See your brand's prices and shelves in every chain
Brand Monitoring by Costless is an analytics service for brands: your SKUs' presence across retail chains, price positioning, competitor comparison, promo activity and informational tracking of deviations from RRP — on a single dashboard.
Your product sits on hundreds of shelves, but you learn what happens to it late — from distributors, field trips and hearsay. Costless assembles the market picture automatically and shows it to you first.
Get a tailored price monitoring offer — Fill in a short brief (~20 minutes) and receive an individual offer within 1-2 business days.
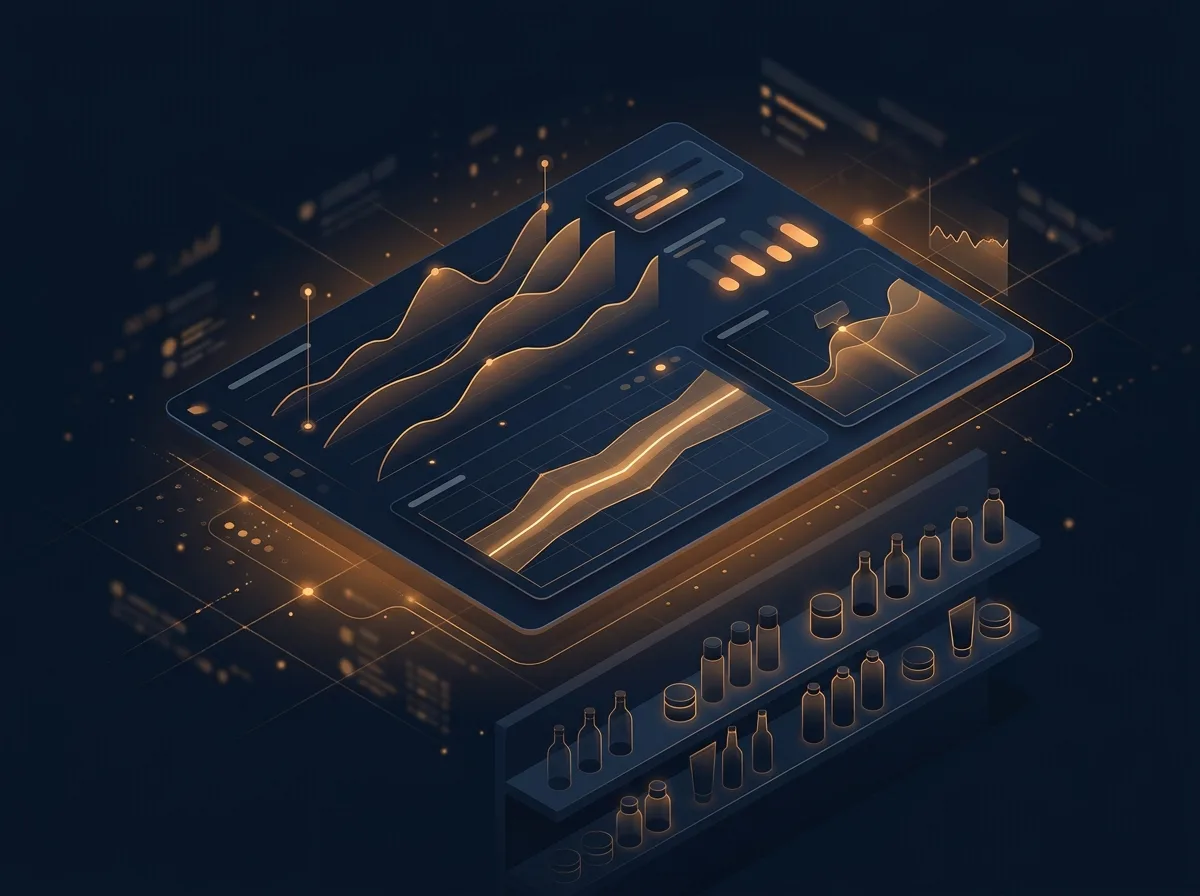
When your brand lives on someone else's shelves
A manufacturer doesn't control the retail price — and doesn't have to. But it must see it: sales, partner margins and how shoppers perceive the brand all depend on it.
Brand managers
How your brand is positioned on price against competitors in every chain — and how that changes week over week.
Sales leaders
Where your assortment is fully represented and where items have disappeared from the shelf — data-backed arguments for the next conversation with a buyer.
Trade marketing
Which competitors are on promo right now, at what discount depth and in which cities — so you plan your own activities with open eyes.
Six views of your brand at retail
Each dashboard block answers a specific working question — no Excel exports, no manual price collection across chain websites.
Distribution coverage
How many of your SKUs are actually present in each retail chain: observations, last-seen date, and the minimum, average and maximum price per chain.
Price positioning
Each chain's price index against your brand's market median: instantly see where you sell above your own median and where below it.
Competitor comparison
Your share of shelf, share of promo and price index against the competitor products you selected — broken down per rival brand.
Price vs RRP
Set a recommended price corridor — and see how many items sell below the floor, inside the corridor and above the ceiling.
Promo radar and geography
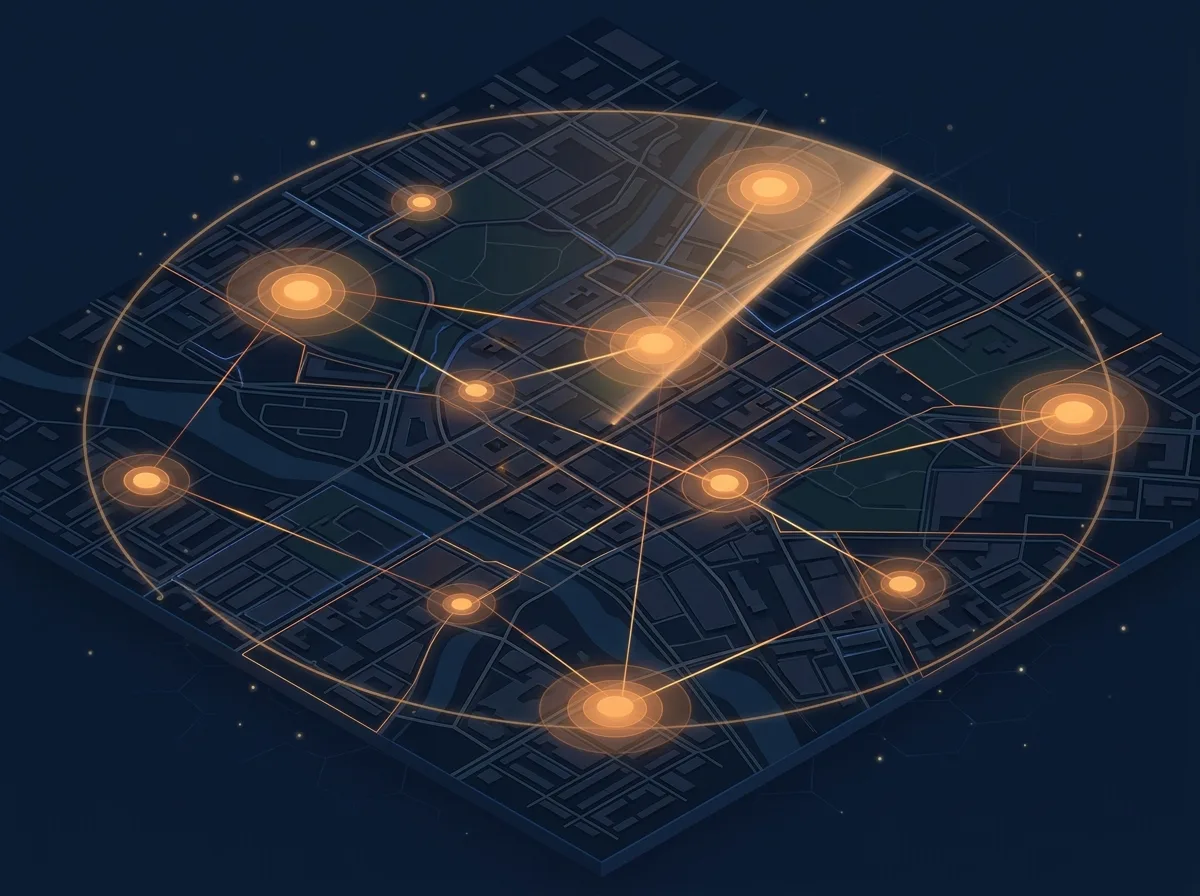
Which chains are currently running promos on your assortment, at what average discount depth, when the campaigns end — and how promo activity is distributed across cities.
Changes and alerts
New and lost shelf positions over the recent period — flagged NEW and LOST — plus email alerts so the important changes never slip by.
The shelf, without the field trips
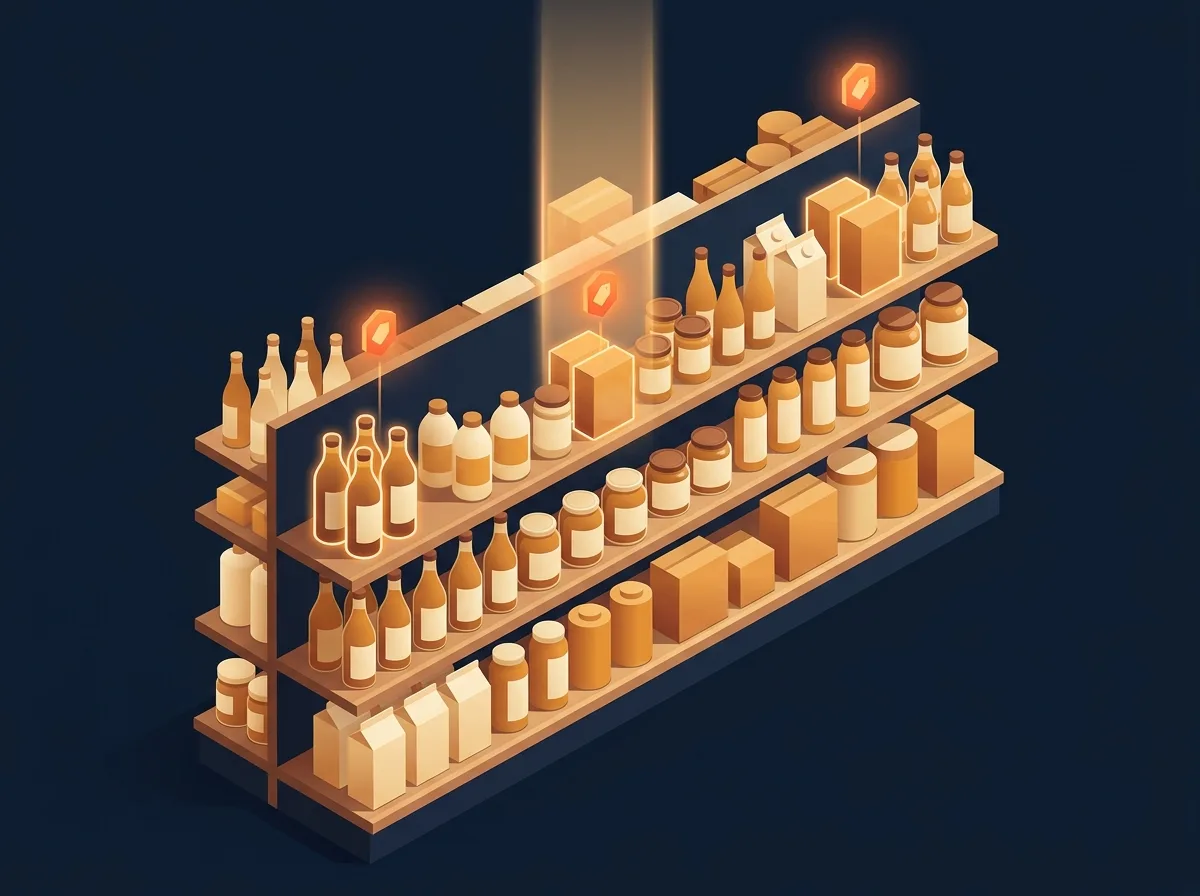
For every chain — whether the SKU is present, how many times we observed it, when it was last seen and in what price range it sells. The confidence badge shows how fresh and complete the data behind each row is.
| Chain | SKU | Confidence | Min | Avg | Max |
|---|---|---|---|---|---|
| Chain A | 14 / 16 | High | 52.90₴ | 56.40₴ | 61.00₴ |
| Chain B | 11 / 16 | High | 54.50₴ | 58.10₴ | 63.90₴ |
| Chain C | 6 / 16 | Medium | 49.90₴ | 55.70₴ | 59.90₴ |
| Chain D NEW | 3 / 16 | Medium | 57.00₴ | 57.80₴ | 58.50₴ |
Competitor promos — input data, not a surprise
When a competitor goes into a deep promo, you learn it from the dashboard — not from a sales dip at month end. The radar shows active campaigns per chain, average discount depth and end dates — plus the city-level distribution of promo activity.
| Rival brand | Share of shelf | Promos | Price vs you |
|---|---|---|---|
| Competitor 1 | 38% | 4 on promo | 93 · cheaper |
| Competitor 2 | 27% | 1 on promo | 108 · dearer |
| Competitor 3 | 12% | — | 115 · dearer |
Four steps to your first dashboard
Setup takes under an hour. After that the system runs itself.
Verify your brand
The dashboard opens only to the brand's owner or official representative — protecting your data from prying eyes.
Build your assortment
Add products or whole product lines to the watchlist — search by name or barcode.
Mark your competitors
Attach competitor products to each of your own — manually or from automatic same-category analog suggestions.
Get the market picture
The dashboard updates automatically, and email alerts report the important changes without any effort on your side.
Honest data — or none
Analytics you can't trust is worse than no analytics. That's why every figure on the dashboard carries the context of where it came from.
✔️ No misleading zeros
Coverage is measured only among the chains Costless actually monitors. A chain we don't see yet shows as "no data" — never as 0%.
✔️ A confidence badge on every row
Observation volume and data freshness are visible at a glance: high, medium or low confidence — you decide what to lean on.
✔️ Transparent methodology
How we collect and process market data is documented on the methodology page, open to every client. Read the methodology →
Frequently asked questions
What is brand-level price monitoring?
It is automated tracking of how one brand's products are represented across retail chains: at what prices they sell, in which chains they are present, how often they enter promos, and how their prices compare with competitors and the recommended retail price. Unlike retailer-oriented price monitoring, the focus here is the brand and its distribution, not a single store's assortment.
Where does Costless get price data?
From regular automated observations of publicly available prices in the retail chains the platform monitors. Every dashboard figure carries a confidence badge — observation volume and last-seen date — so you always know how fresh the data is.
Can Costless force chains to follow my RRP?
No — and that is a matter of principle. Retailers set prices independently, and the "Price vs RRP" feature is strictly informational: it shows the factual picture but is not an enforcement tool. The data is useful for your own analytics and for better conversations with partners.
How are competitors chosen for comparison?
You control the list: attach competitor items to each of your products via search by name or barcode, or accept automatic analog suggestions — the system picks same-category products with similar attributes. The dashboard comparison is built on exactly these links.
Why is brand ownership verification required?
The brand dashboard contains sensitive market analytics, so access opens only after confirming you are the owner or an official representative of the brand. This protects your data from competitors and third parties.
How do I get started?
Write to us via the contacts page — we'll discuss your assortment and the chains you care about, and configure the dashboard for your brand. There is no self-service signup for this product: every onboarding is guided by our team.
See your brand through the market's eyes
Tell us about your assortment — and we'll show you what your Brand Monitoring dashboard will look like.
Get a tailored price monitoring offer — Fill in a short brief (~20 minutes) and receive an individual offer within 1-2 business days.