«Where are we sold dearer than usual?»
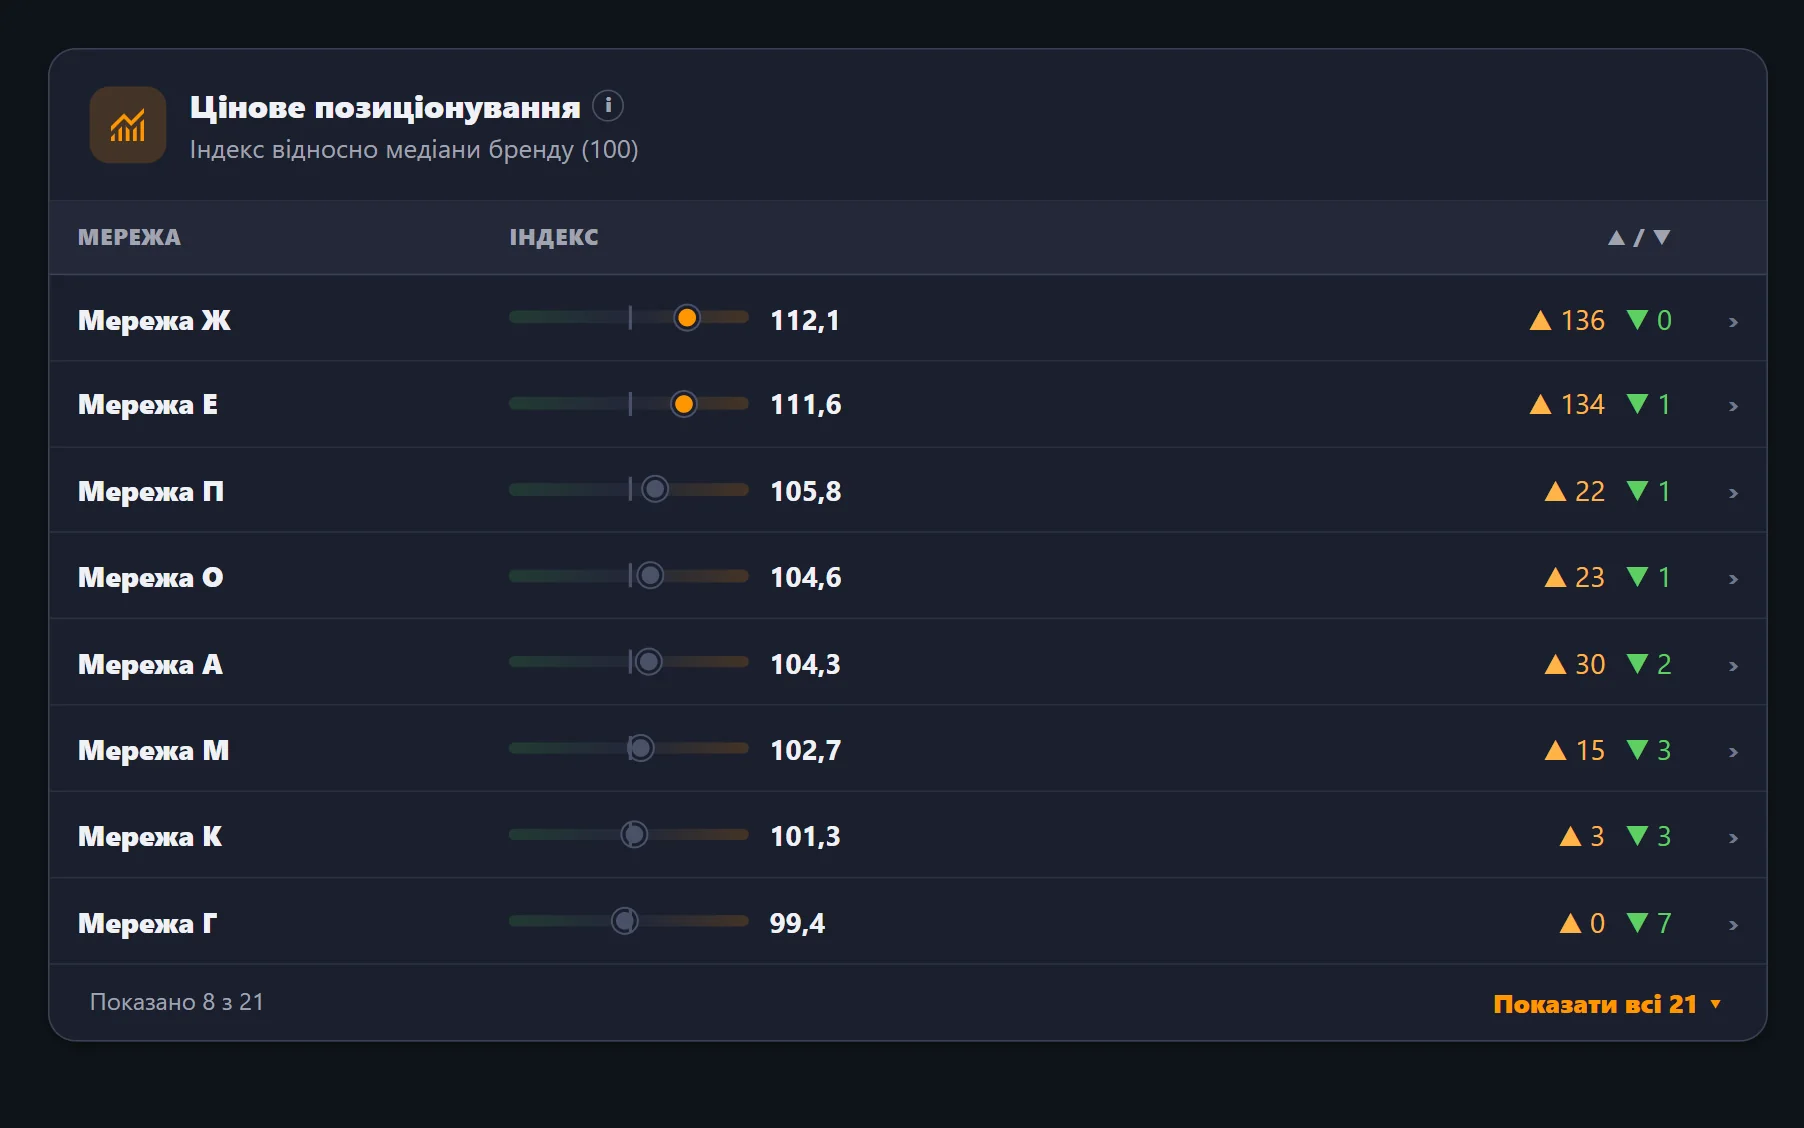
Price positioning shows each chain's index against the median price of your products in the country, so you see where you sit above the market and where below.
The «Prices» section →Brand Monitoring is a dashboard for manufacturers and brand owners. It shows which retail chains carry your products, at what price they sell, which promotions run on your range, how you compare with the competitors you choose and what has changed on the shelf over the last two weeks.
How we count — methodology →
The shelf price is set by the chain, not by the manufacturer. Yet sales, partner margins and how shoppers see the brand all depend on it. The dashboard answers the questions of three teams.
«Where are we sold dearer than usual?»
Price positioning shows each chain's index against the median price of your products in the country, so you see where you sit above the market and where below.
The «Prices» section →«Which chains do not have us on the shelf?»
Presence by chain, the list of chains without your range and the changes over two weeks: where new listings appeared and where there are fewer.
The «Presence» section →«Where are the promotions now, ours and our rivals'?»
Promotions on your range by chain: discount depth, end date, cities. Next to them, your share of promotions against the competitors you chose.
The «Promotions» section →Screenshots of the live dashboard on the demo range of a confectionery brand. The names of the brand, rivals and chains are anonymised; the numbers are real.
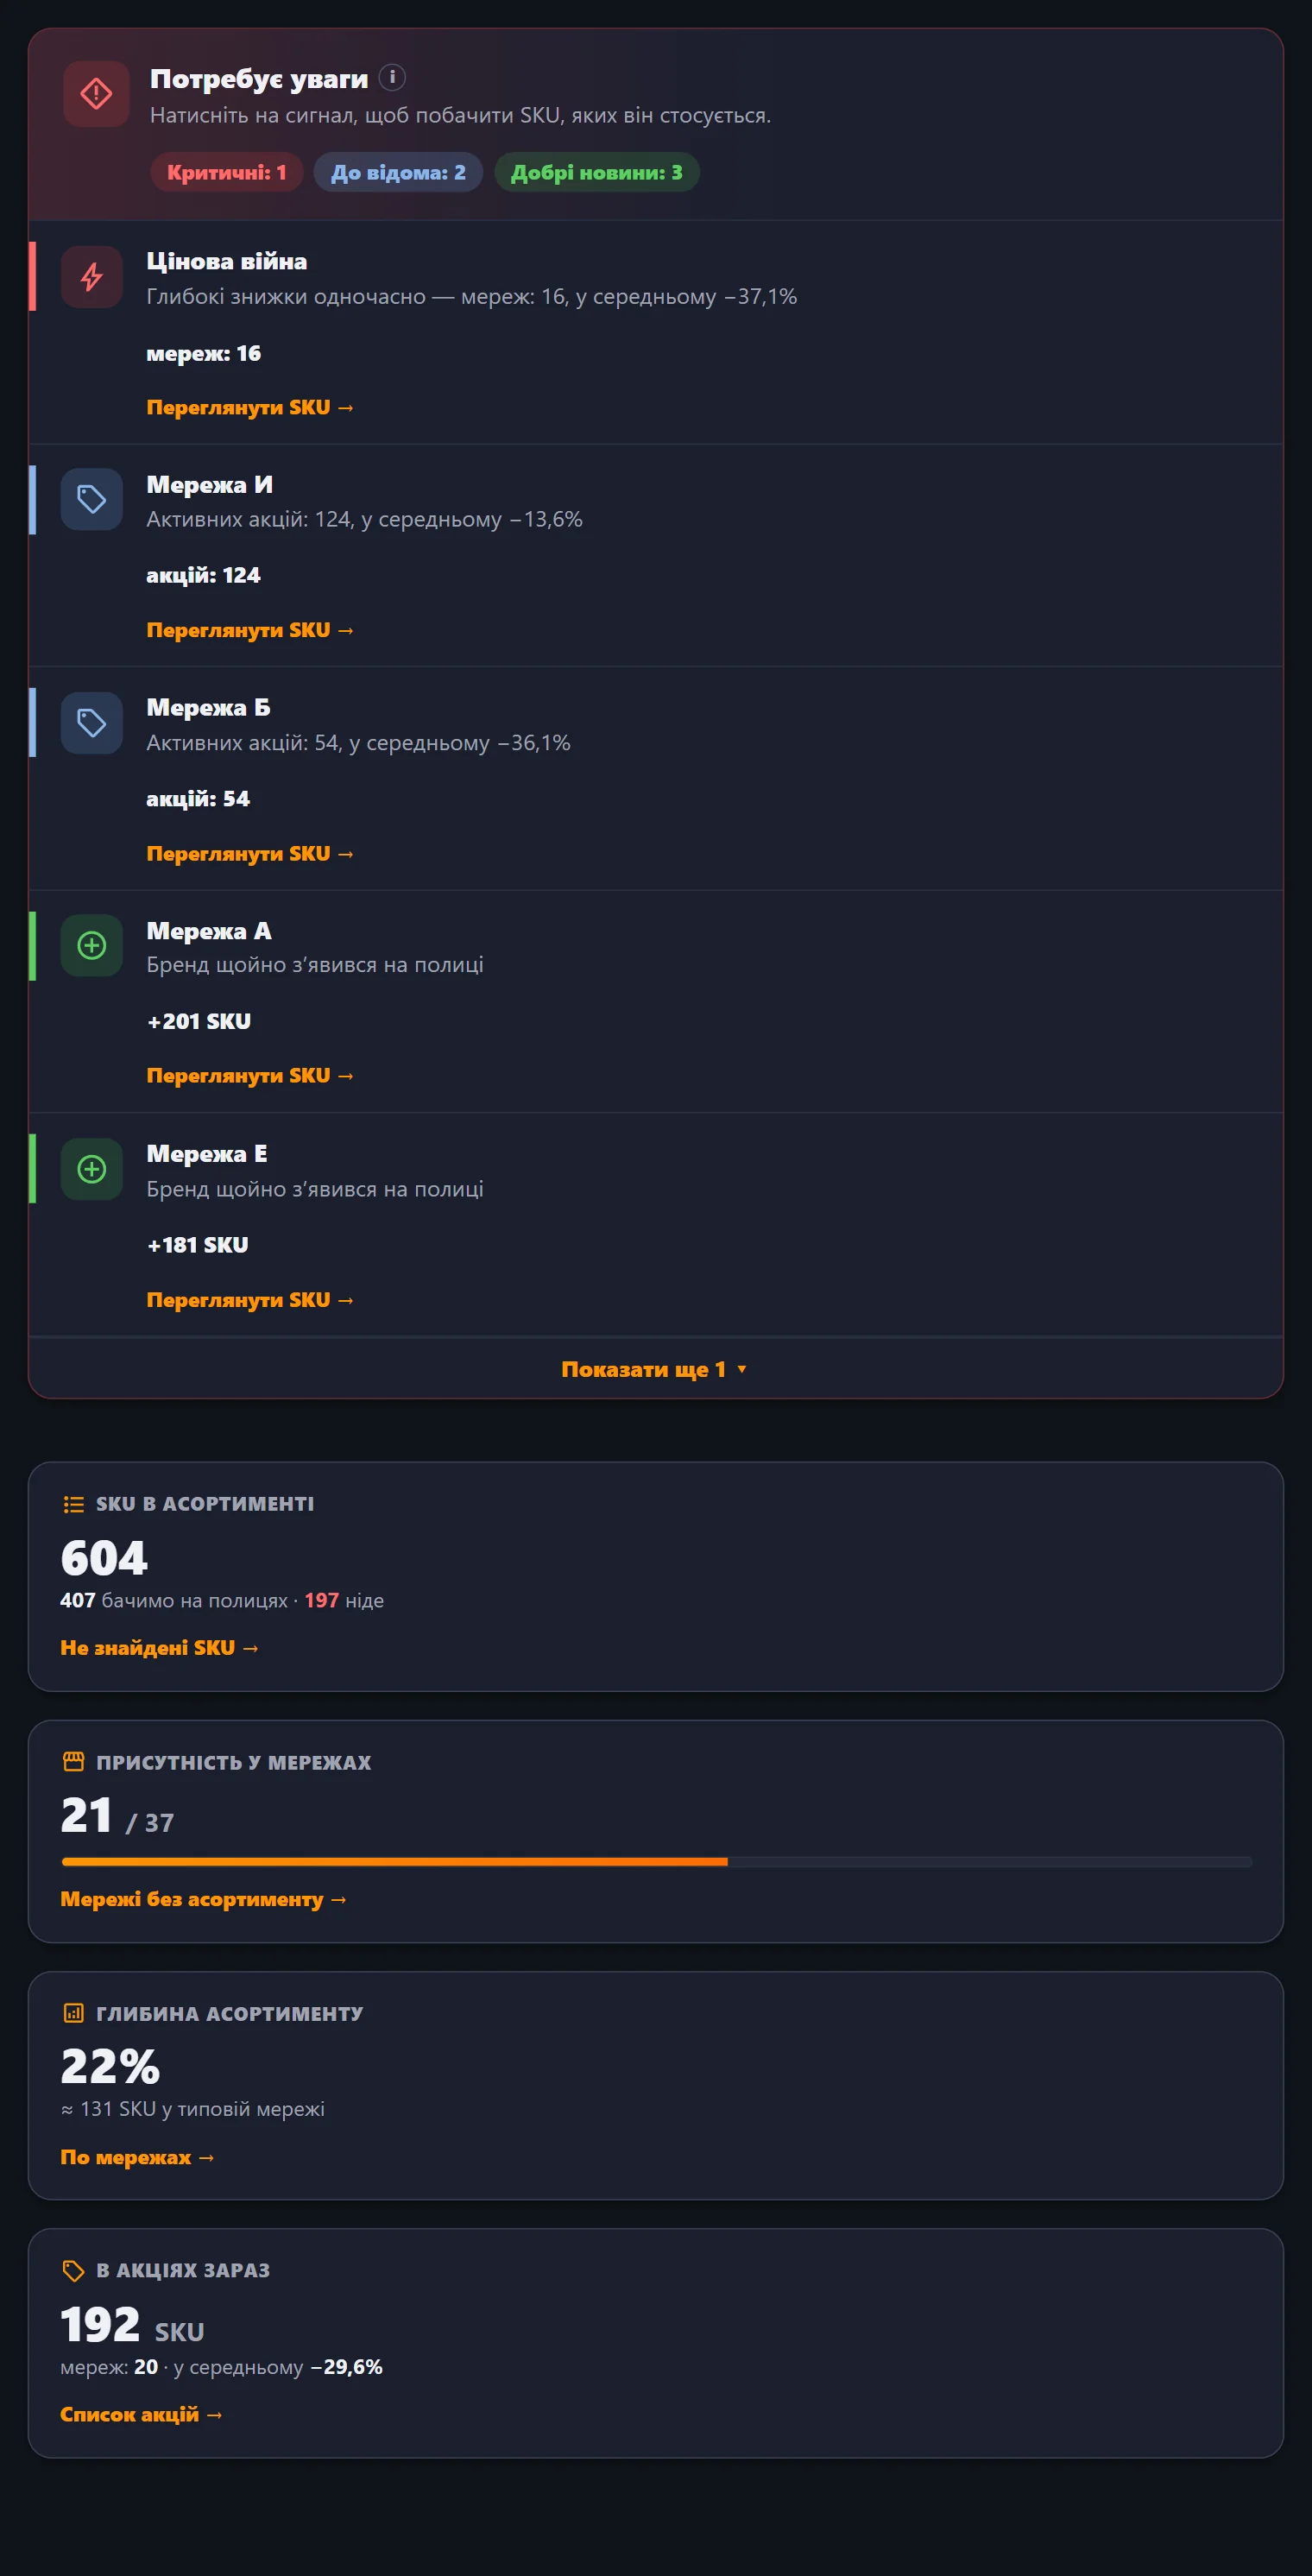
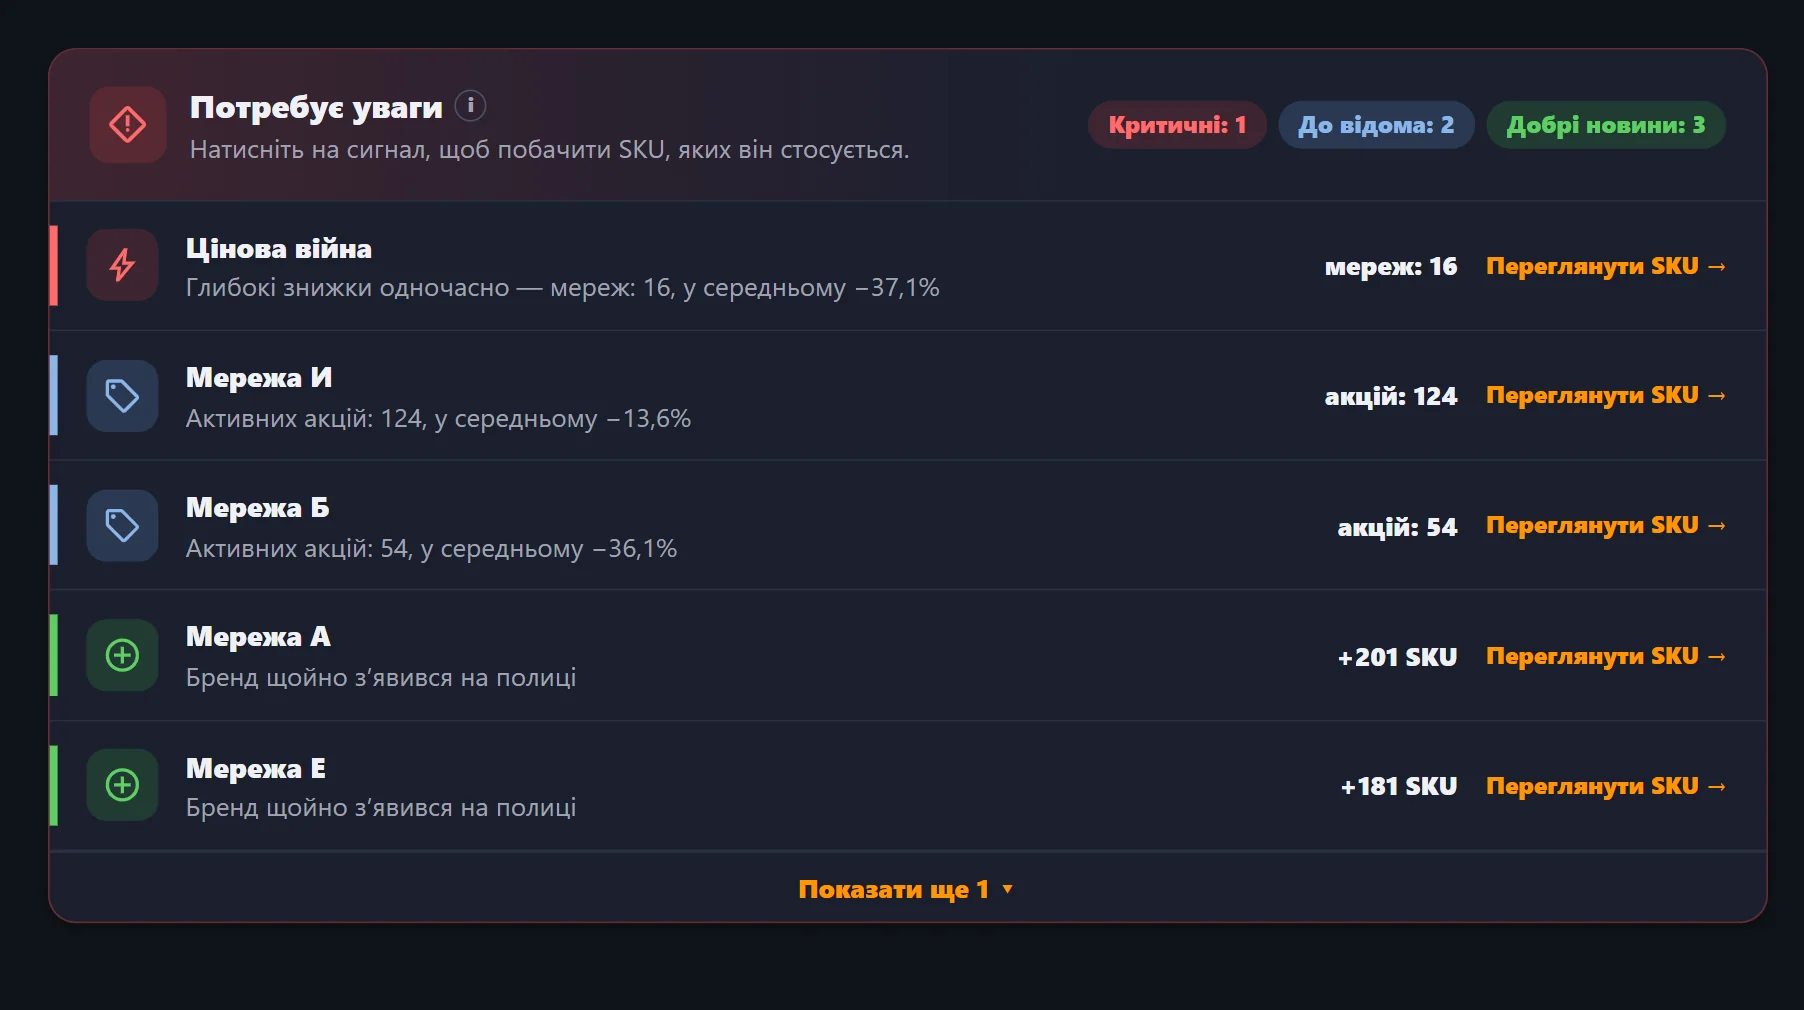
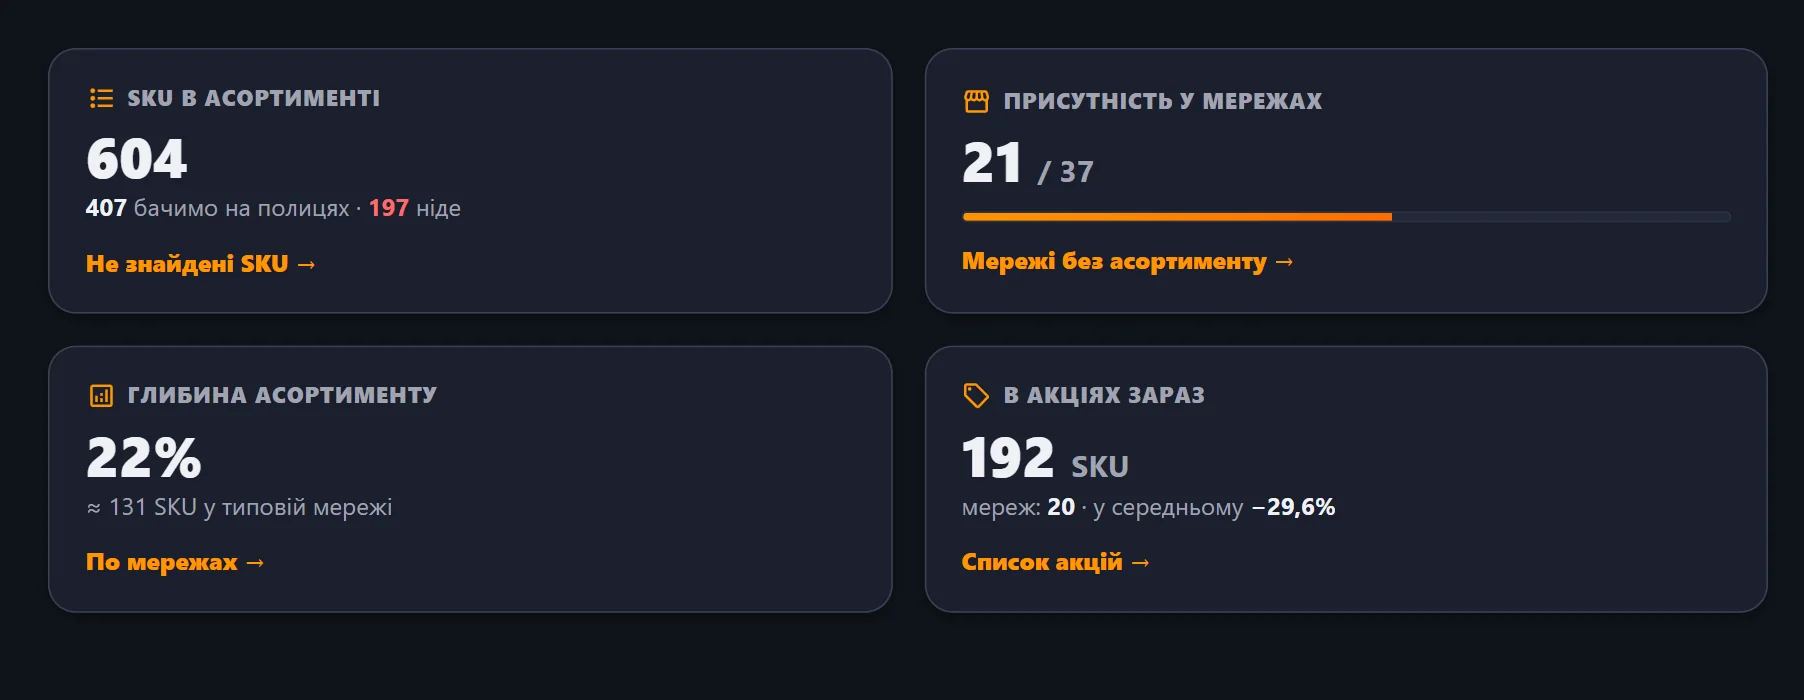
The dashboard compares the last 14 days with the previous 14 and puts what deserves a look at the top. Click a signal to see the products it concerns.
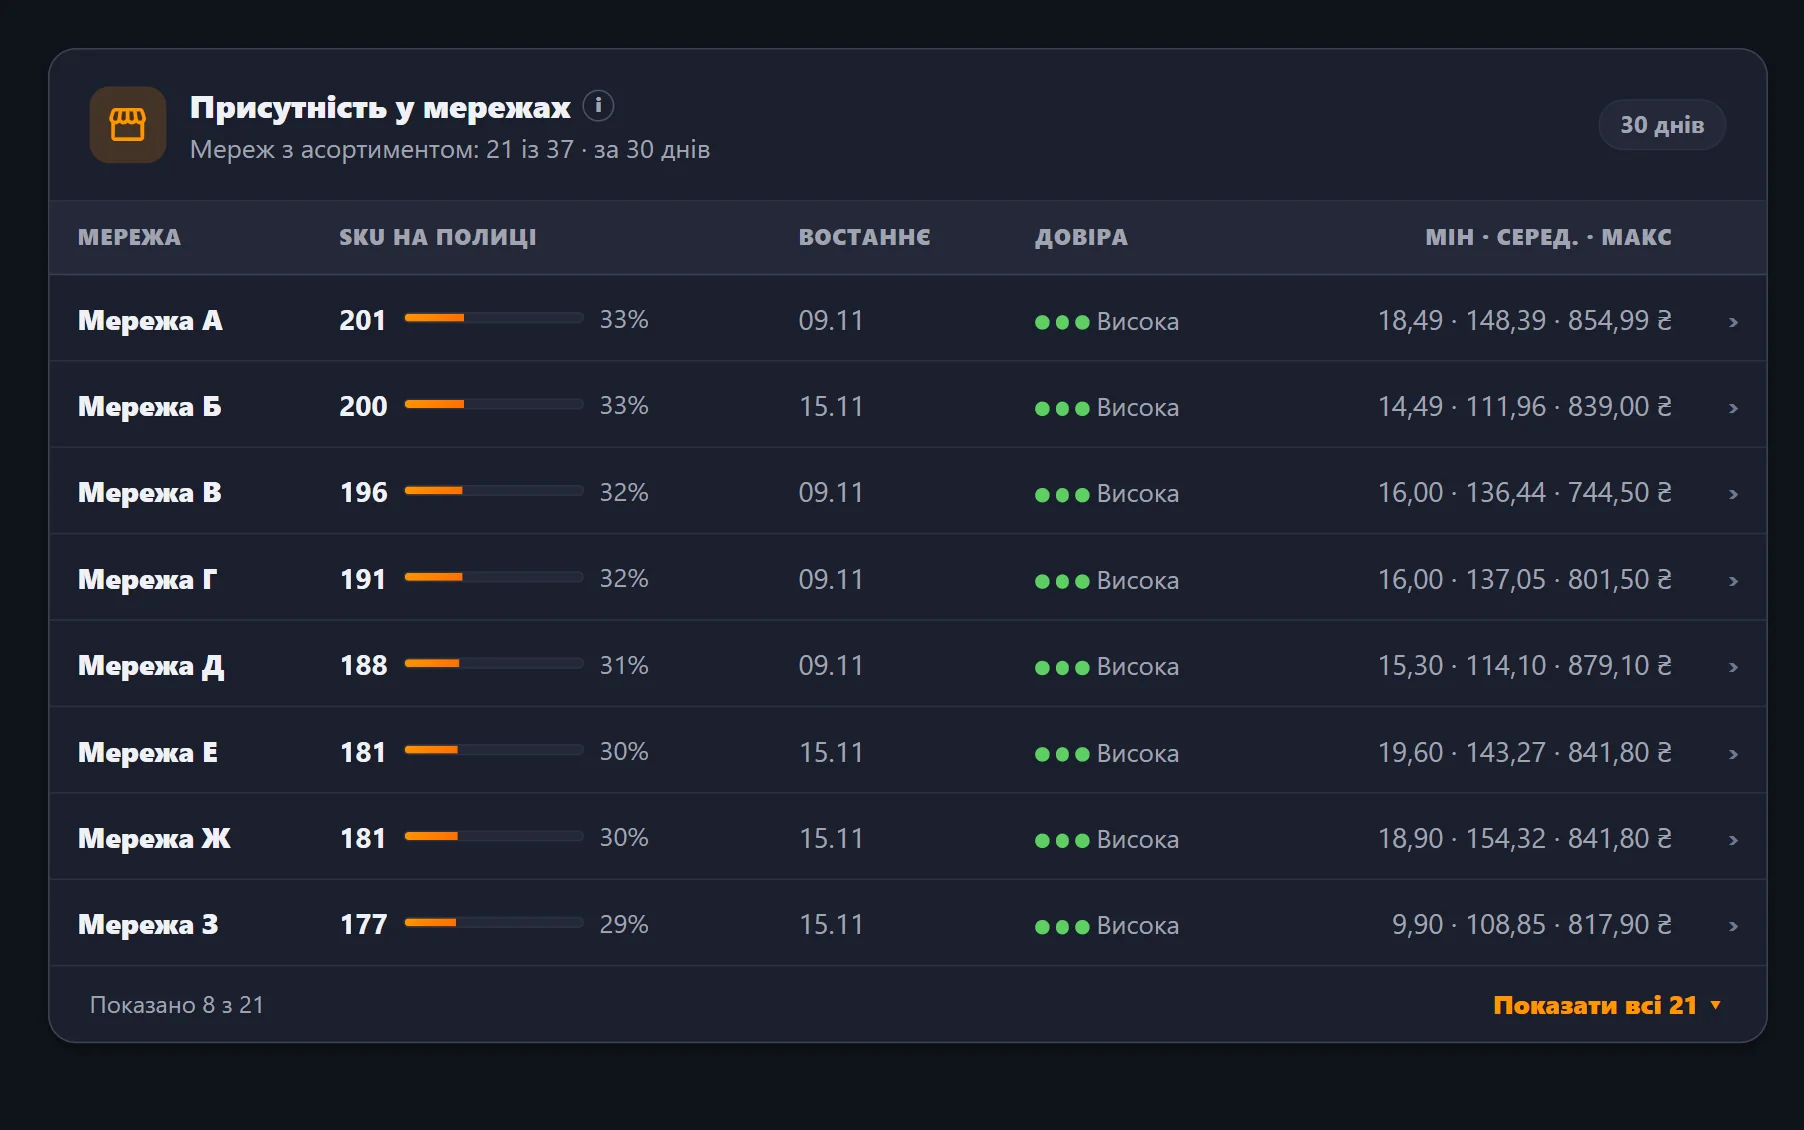
For every chain: how many of your products are on the shelf, when they were last seen, the minimum, average and maximum price. Chains without your range come as a separate list.
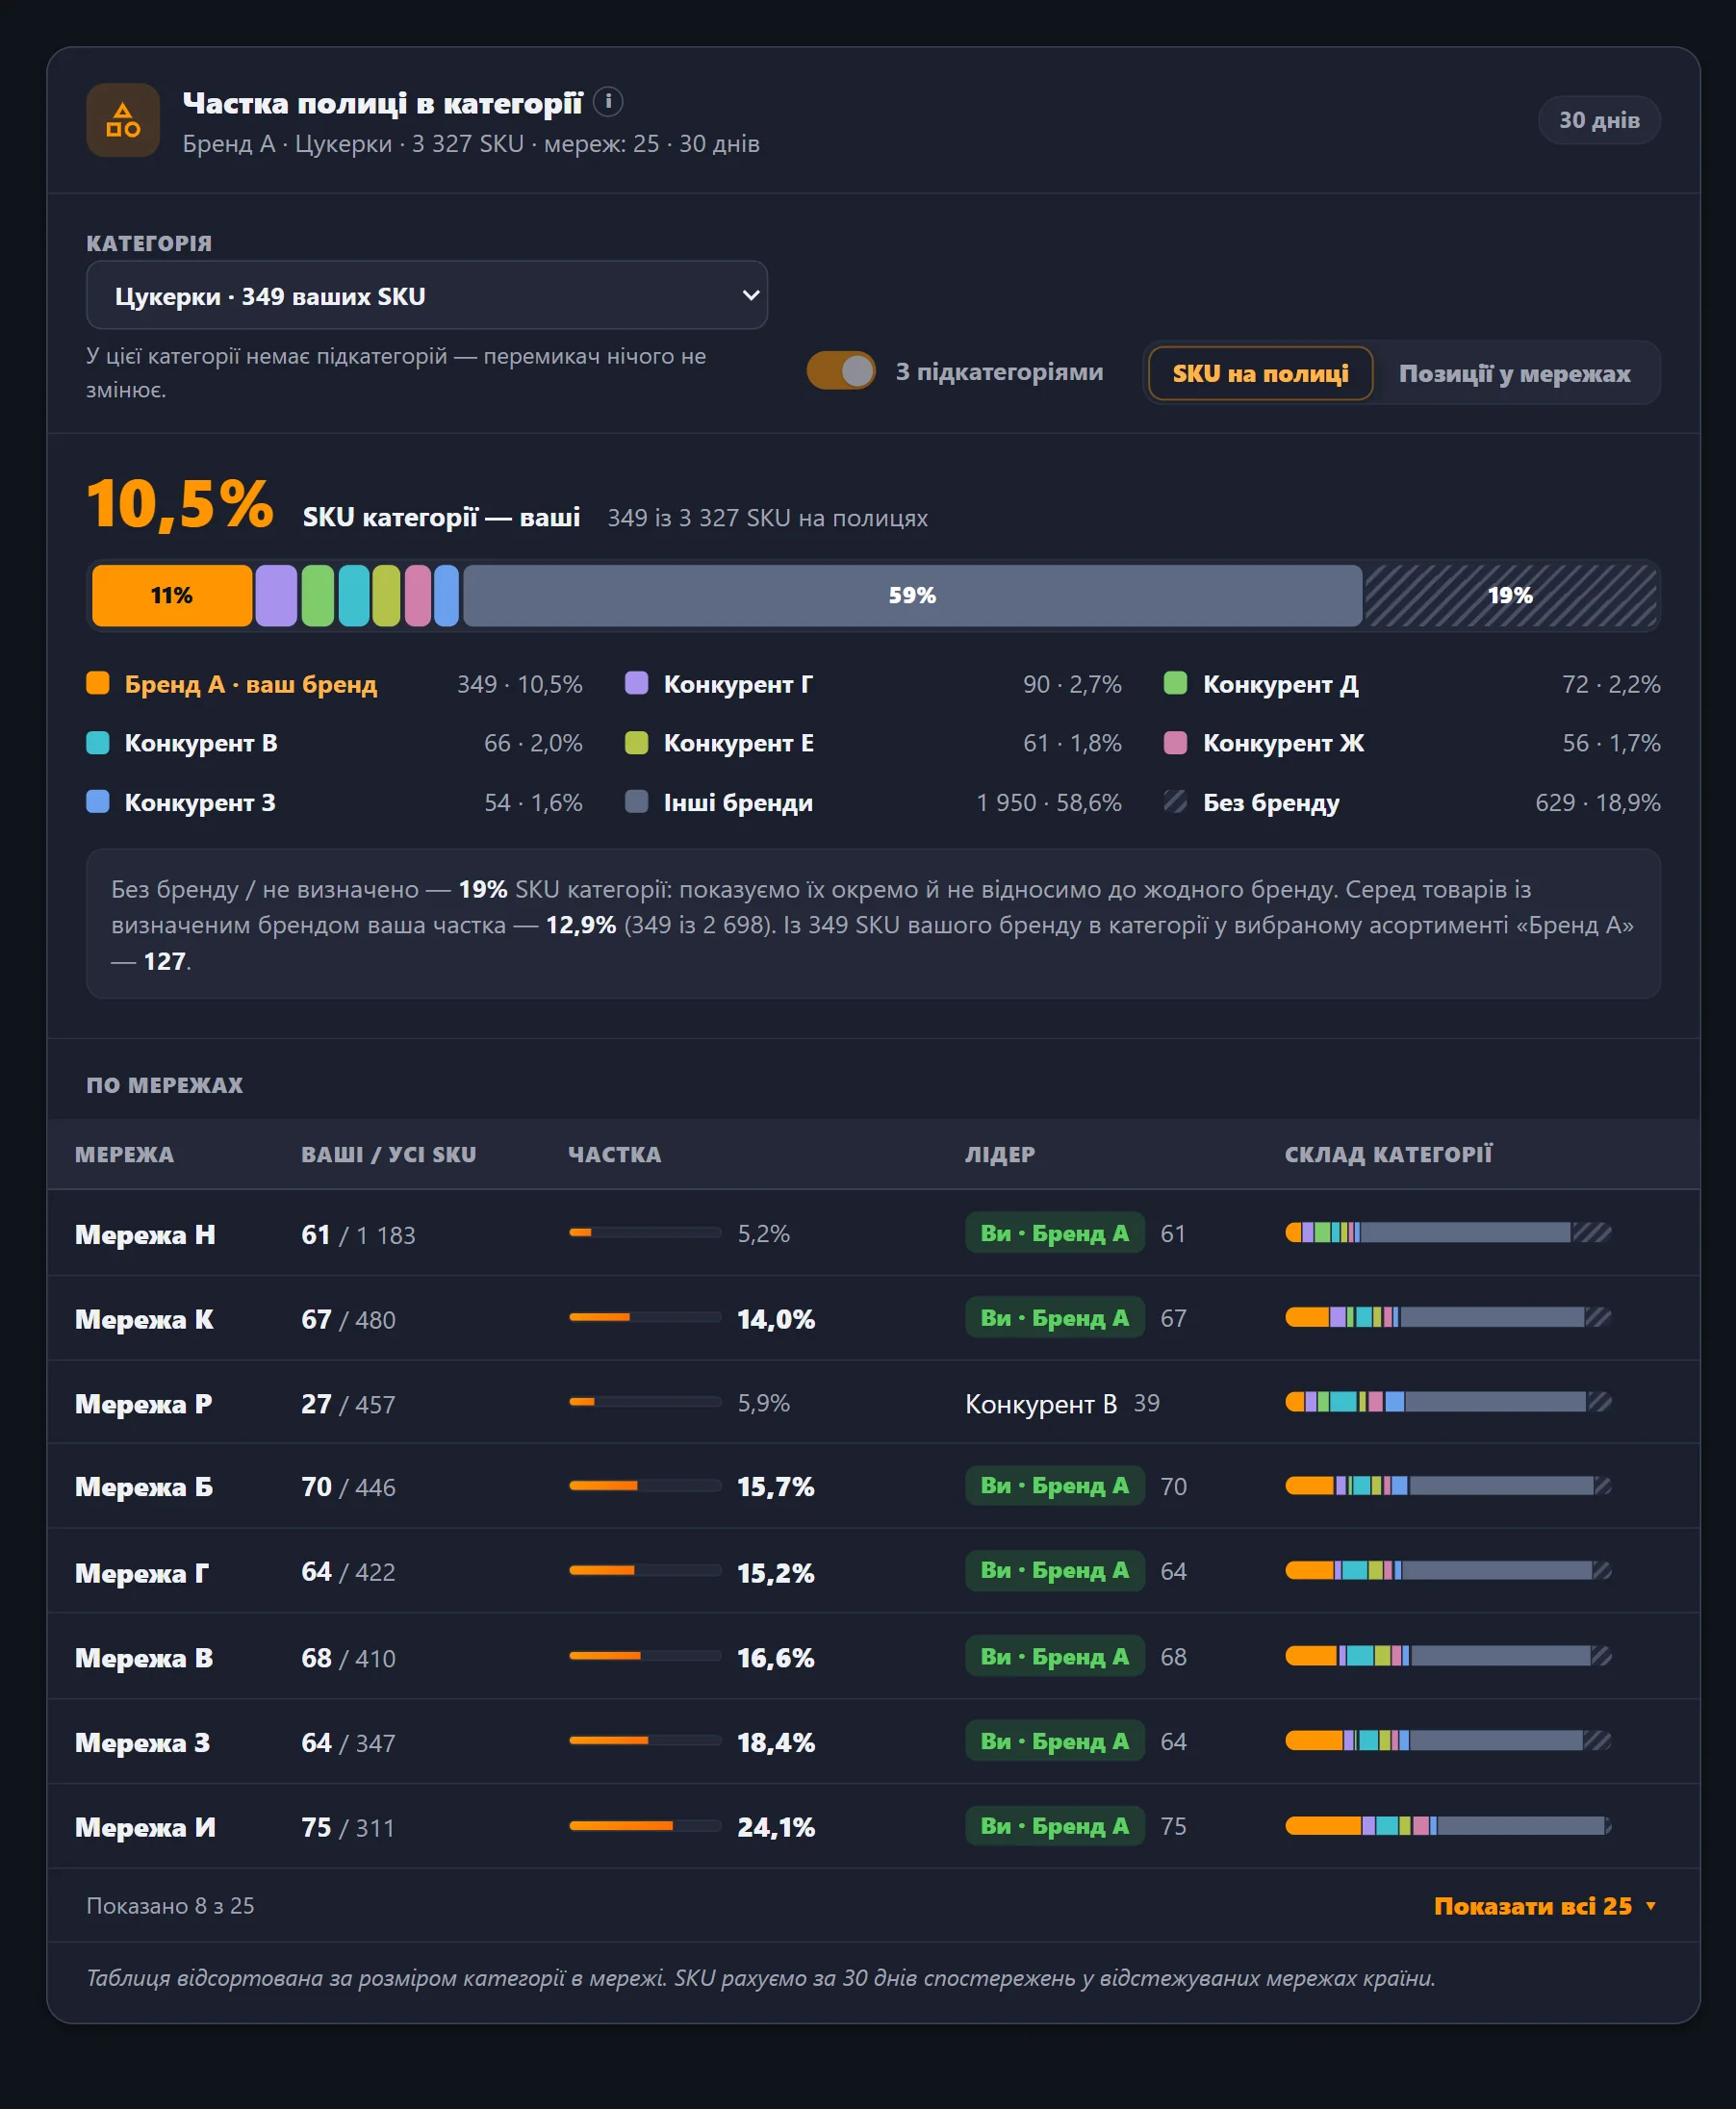
How many of the category's products on the shelves are yours and how many belong to other brands. For every chain you see the category leader.
For each product we take its median price across the chains of the country; that is 100. A chain's index shows how far above or below that median it is on average.
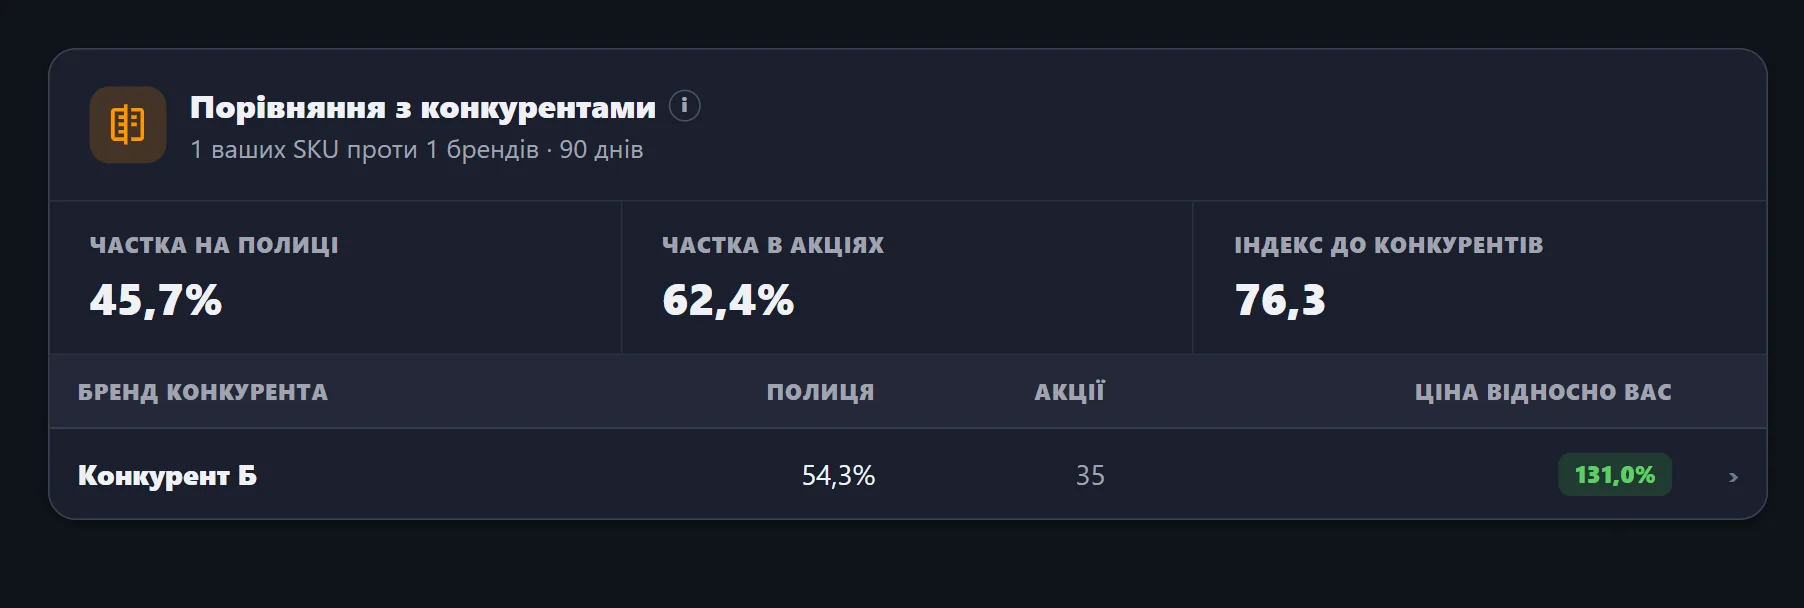
You attach competitor products to your own: by searching a name or barcode, or from suggestions the system picks by category and product attributes.
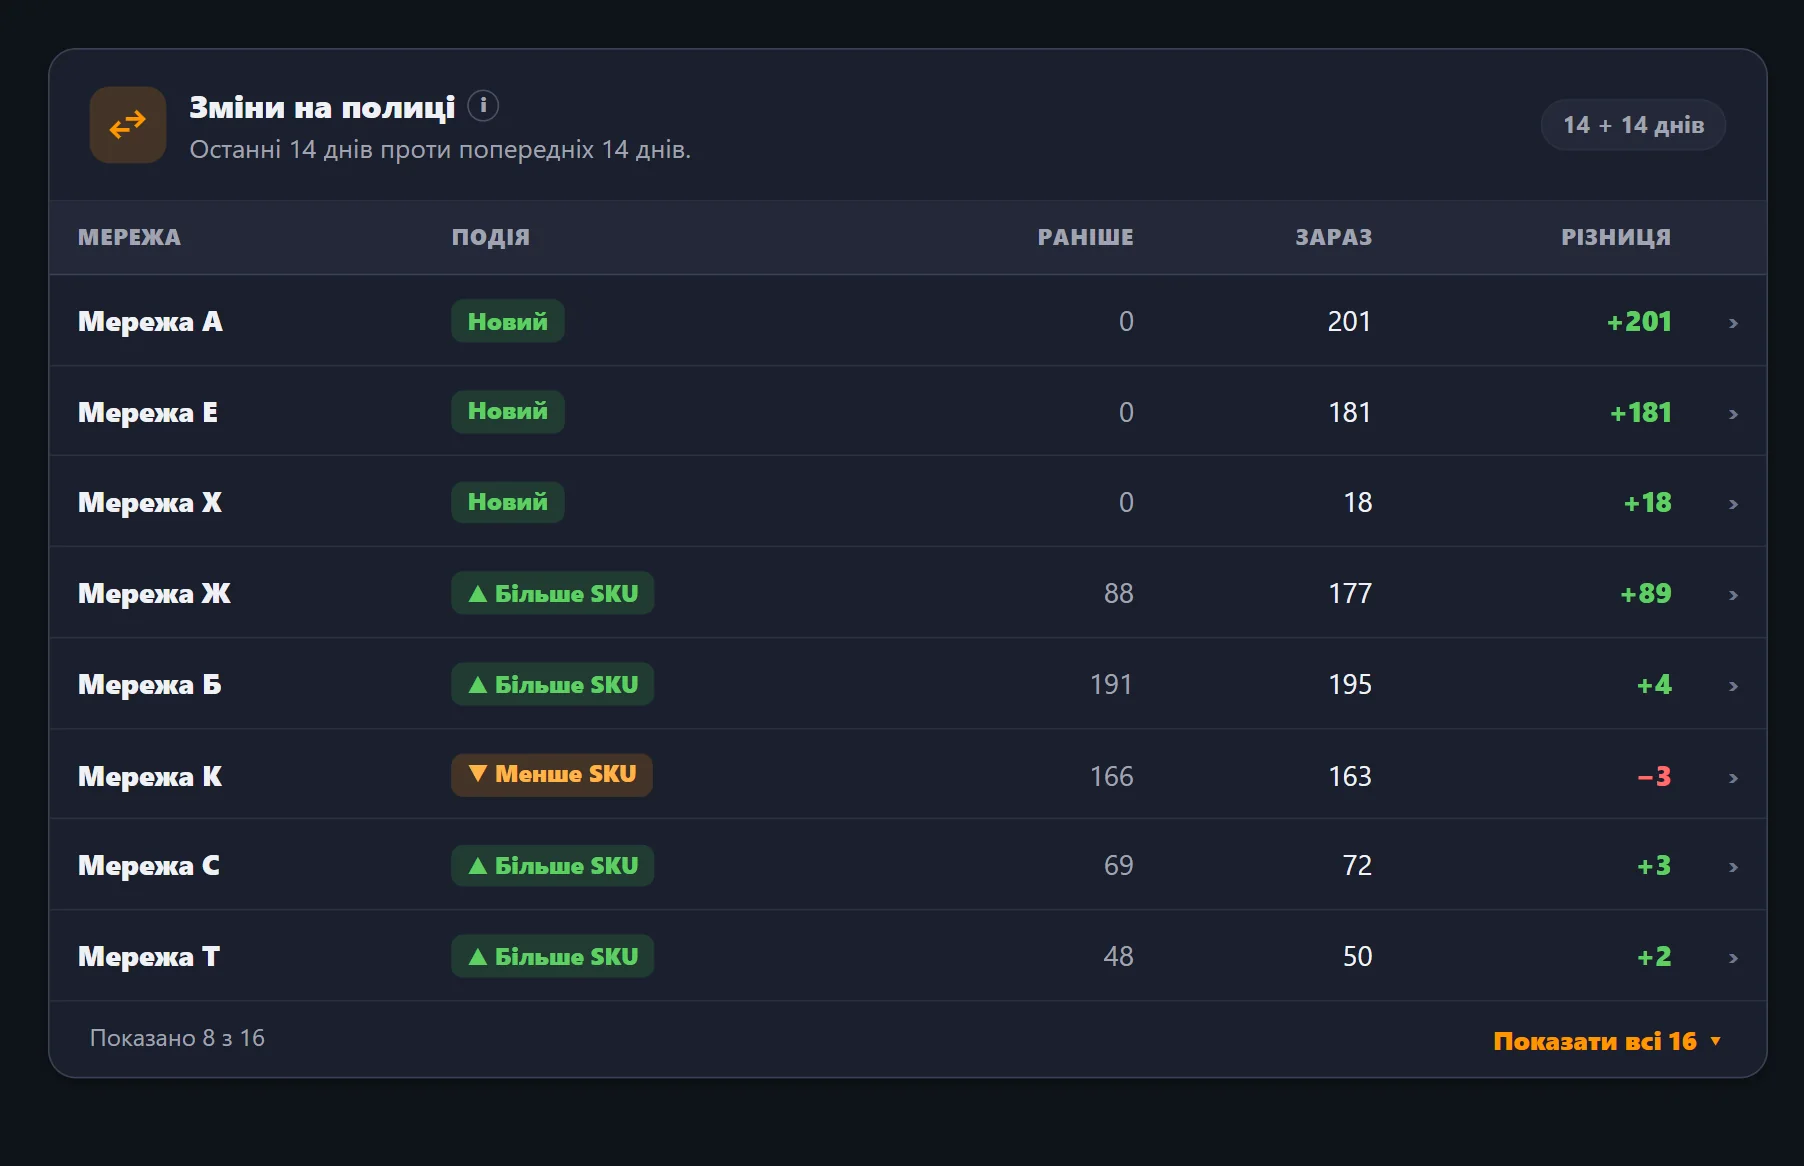
The last 14 days against the previous 14: which chains you appeared in, where you have more products and where fewer.
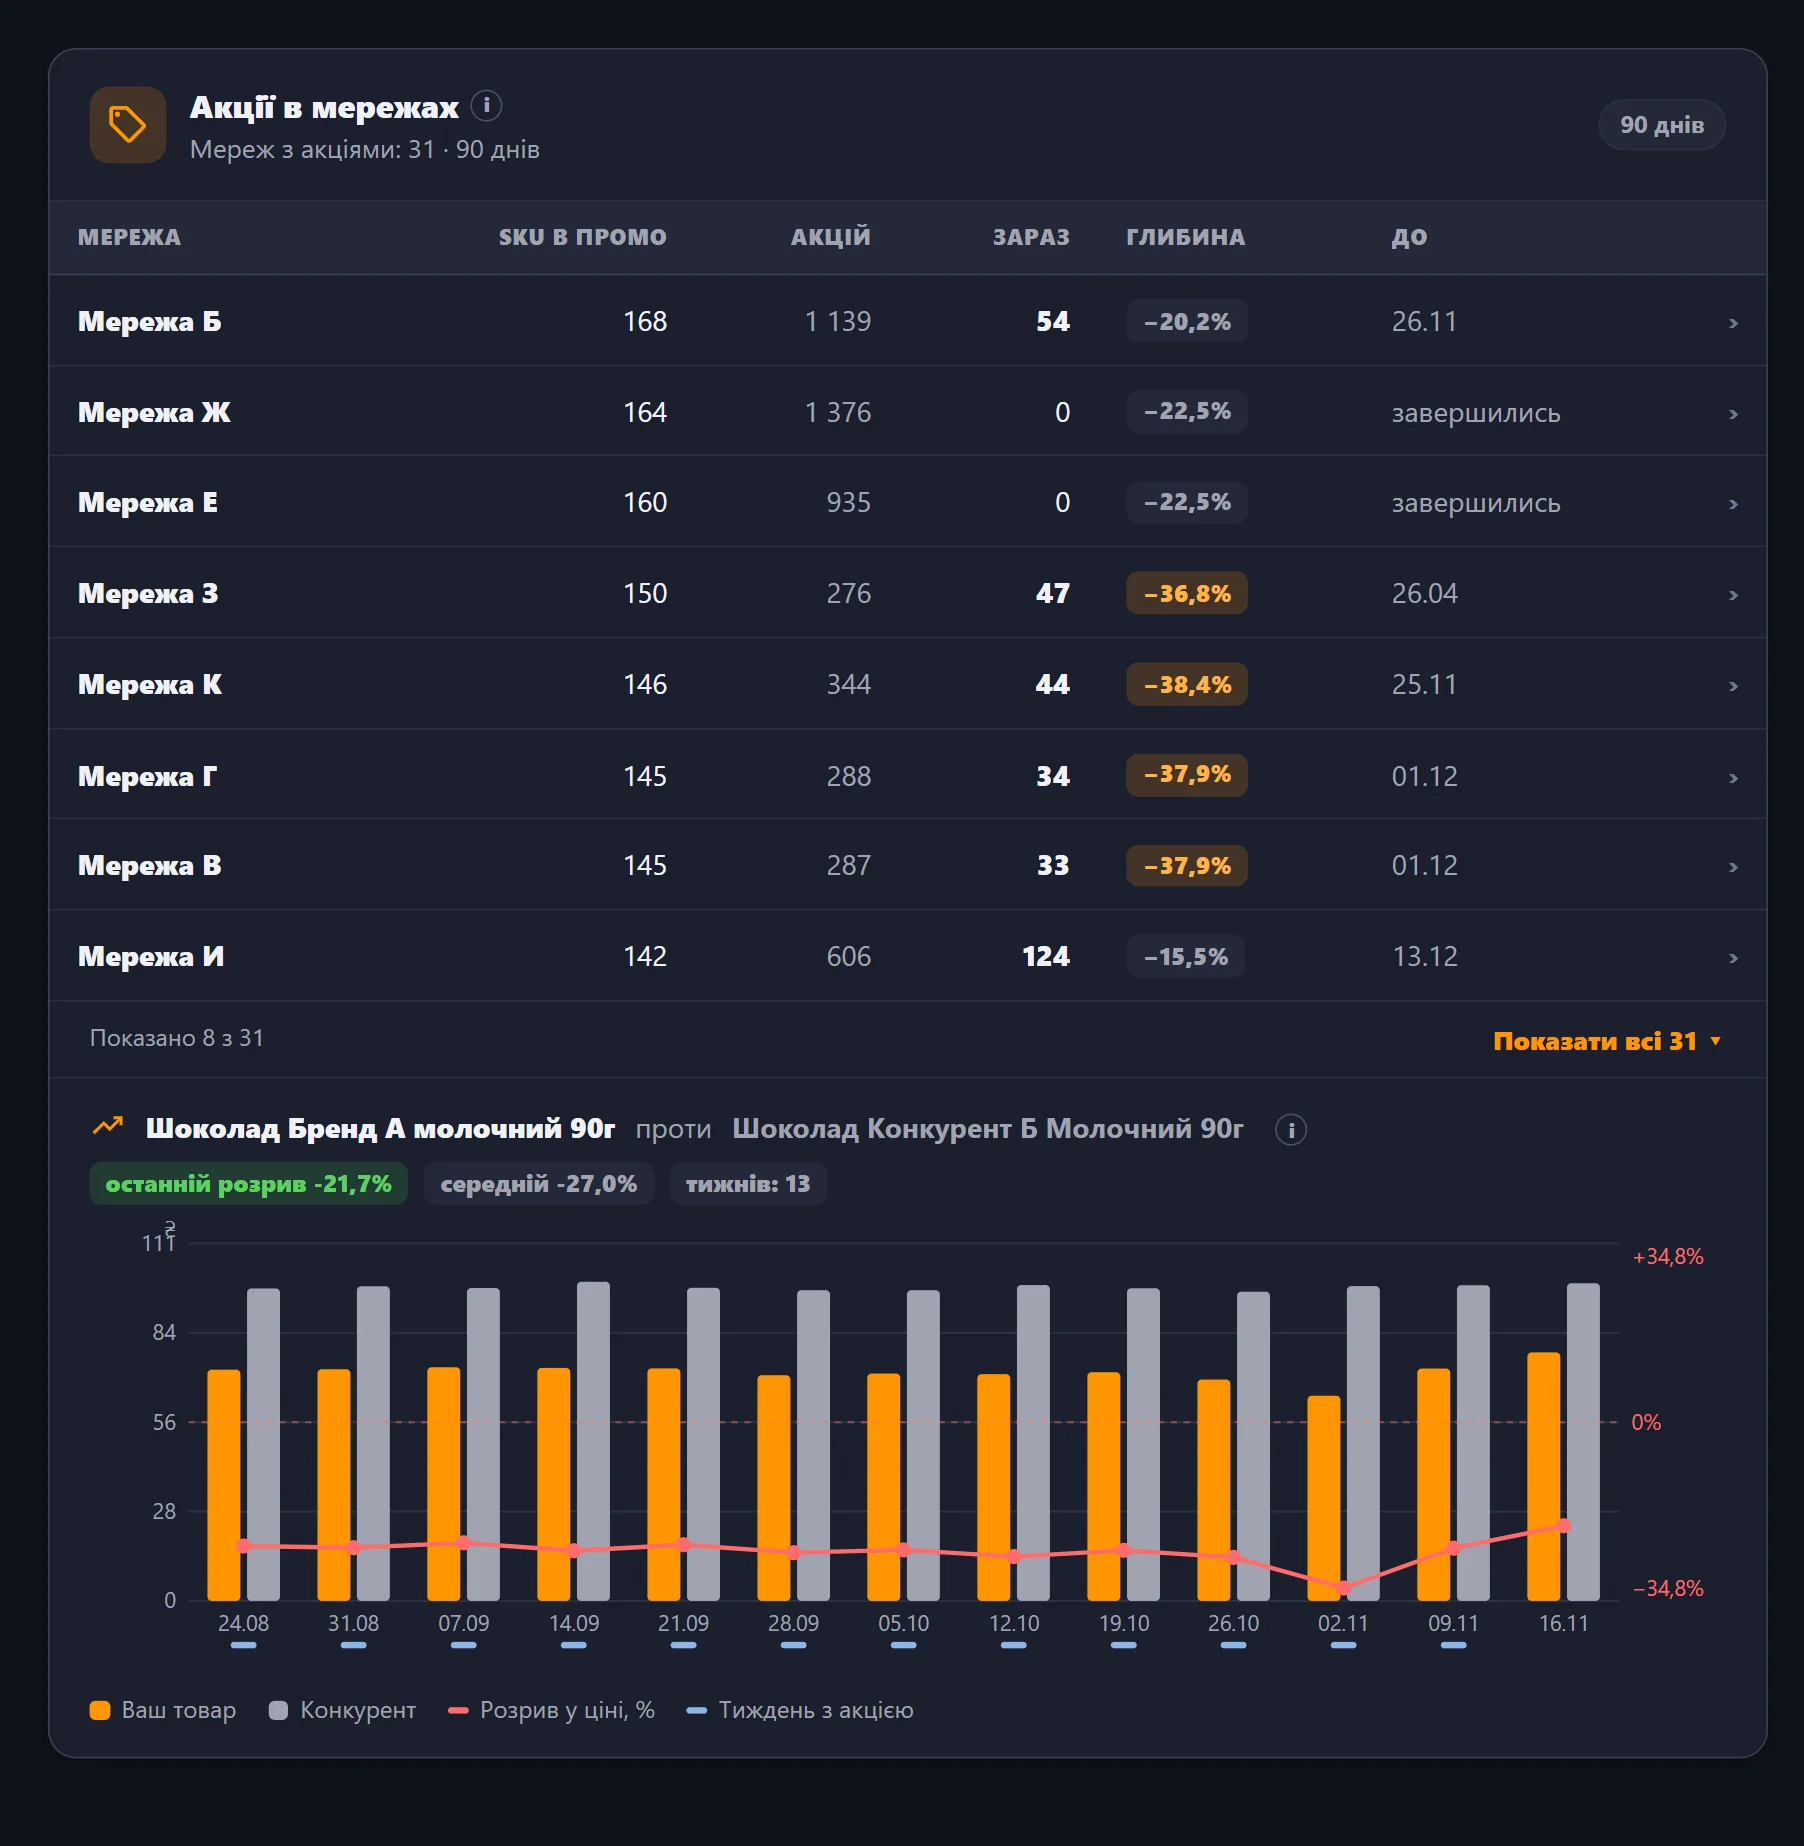
How many products were on promotion, how many promotions are running now, the average discount depth and the end date. Below, a weekly price chart of your product against a competitor's.
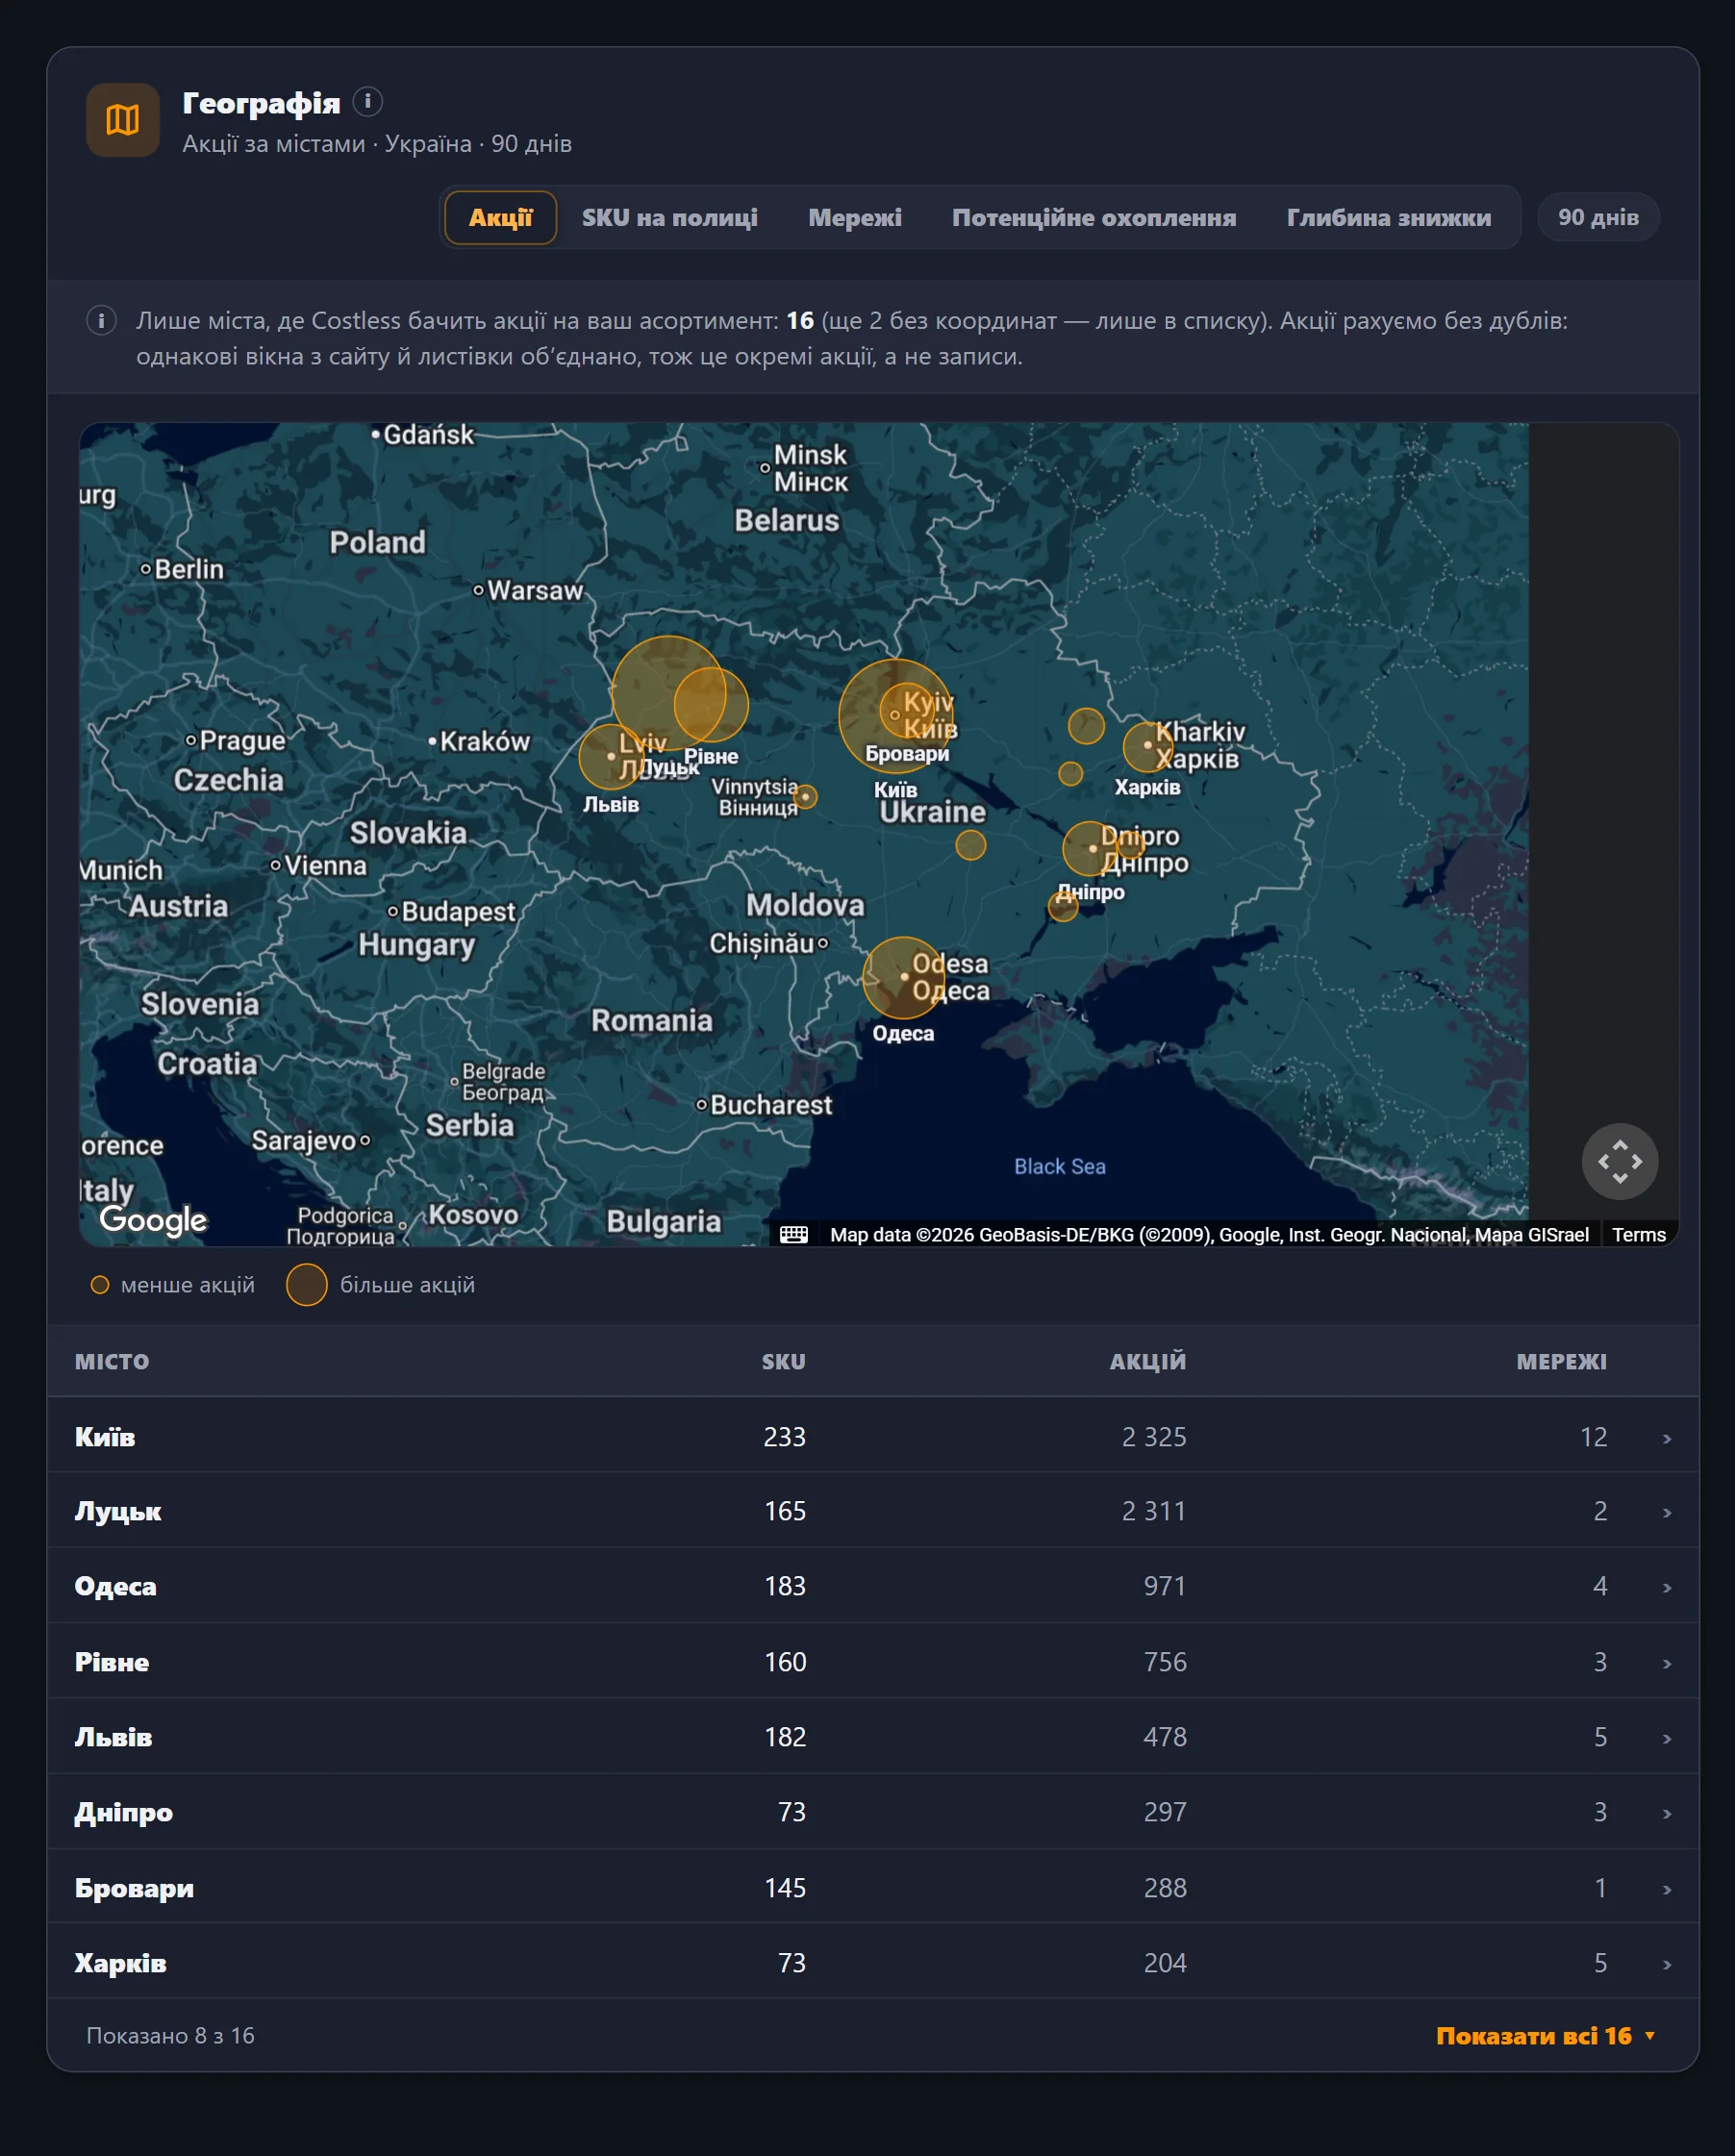
A map of the cities where Costless sees promotions on your range: number of promotions, products on the shelf, chains, potential reach and discount depth.
You do not have to open the dashboard every day: signals arrive in the channels you already use, and you can set a recommended price for every product.
The same signals as in the «Needs attention» block, daily or weekly, at the hour that suits you. You choose the minimum importance, so there are no empty messages. Critical signals can arrive straight away.
For every product you can set a minimum, recommended and maximum price. The dashboard shows how many products in each chain are below the corridor, inside it and above it.
The recommended price is information only. Chains set their prices independently; Costless does not control them and takes no action against chains.
Our team guides the set-up. After that the dashboard updates itself.
Tell us about the brand, products, countries and chains that matter to you. It takes about 10 minutes.
Together we build the product list: single items or whole product lines, by name or barcode search.
You confirm that you represent the brand: company details and a document. A person reviews it, and then the dashboard opens.
If you wish: competitor products, a recommended price corridor and alert channels.
Analytics you cannot trust is worse than no analytics. So every figure on the dashboard shows where it comes from.
Both products run on the same Costless data, but they answer different questions.
| Question | Brand Monitoring | Price Insights |
|---|---|---|
| Who it is for | Manufacturers, brand owners, distributors | Retail chains and shops |
| Main question | Where and at what price my brand is sold | Are my prices competitive against other chains |
| Whose products | Your products in every chain of the country | Your catalogue against the same products at competitors |
| Main sections | Presence, shelf share, price index, promotions, map | Price comparison, trends, competitor ranges |
Are you a retailer? Price Insights →
Tell us about your brand and the chains that matter to you.
Fill in the briefIt is regular tracking of how one brand's products are represented in retail chains: which chains carry them, at what prices they sell, how often they go on promotion and how their prices compare with competitors. Unlike price monitoring for a retailer, the focus is the brand and its distribution, not the range of one store.
Prices come from the websites of the retail chains Costless tracks regularly. Promotions also come from recognised flyers; the same promotion from different sources is merged. Every figure shows its trust level: how many observations there were and how fresh they are.
In the last 30 days Costless received prices from more than 100 chains in over 30 countries, the most in Ukraine, Poland and Lithuania. The dashboard shows one country at a time; the country switch is at the top. Presence is counted only among the chains we actually see in that country.
No, and that is a matter of principle. Chains set their prices independently. The recommended price corridor only shows the actual picture: how many products are below, inside and above it. Costless does not control prices and takes no action against chains.
You attach competitor products to each of your own: by searching a name or barcode, or from suggestions the system picks among products of the same category with similar attributes. The comparison on the dashboard is built on exactly these pairs.
The dashboard holds sensitive analytics about the brand, so it opens only after you confirm that you are the owner or an official representative of the brand. A person reviews it. This protects your data from competitors.
By email, in Telegram or to your webhook, daily or weekly, at the hour that suits you. You choose the minimum importance of signals; if there is nothing new, no message is sent.
The terms depend on the number of products, countries and alert channels. Fill in a short brief, about 10 minutes, and we will send an individual offer within 1–2 business days. Our team guides the set-up.
Tell us about your range and the chains that matter to you, and we will show you what your dashboard will look like.
Also: prices from store shelves · Price Insights · methodology