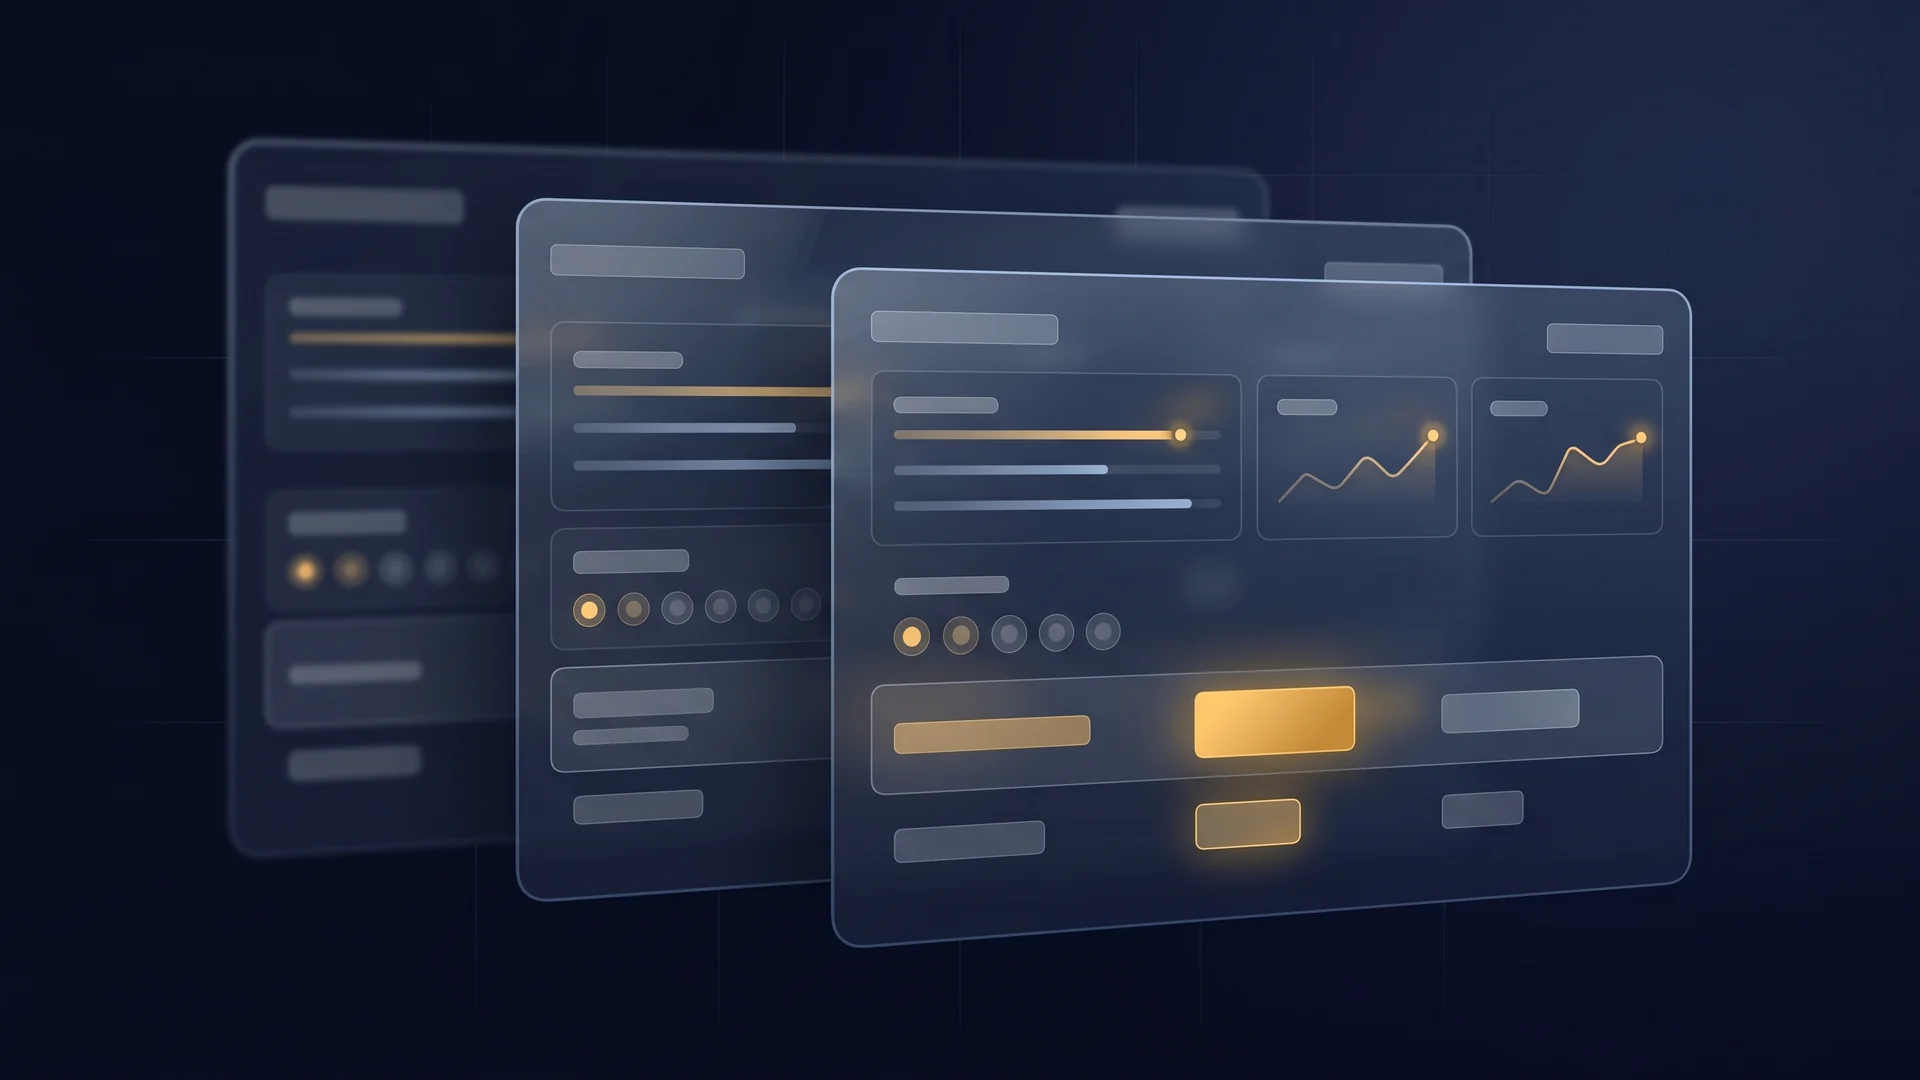
Price intelligence from real shopping data
Costless Insights turns shopper receipts, retailer catalogs, direct site coverage and in-store price-tag photos into one barcode-level dashboard — side-by-side price comparison across retailers and per-product price trends over time, with CSV and API export. Available as a SaaS subscription.
Four data sources. One product graph.
We do not only crawl websites. We see what shoppers actually paid, what promo catalogs actually promised, what every retailer displays online, and what the shelf says in-store — then reconcile every signal to a single barcode.
240,000+ shopper receipts processed — most from Ukraine, plus Poland, the UK and Lithuania. A receipt captures the price actually paid, including loyalty-card discounts and basket-level promos that crawlers never see.
Weekly OCR of PDF catalogs and promo banners — including chains that publish offers only in print. Captures the promo window, the exact discount mechanic and the combined conditions behind every offer.
Custom parsers for 90+ retail chains in 25+ countries, with daily-to-weekly refresh. Captures shelf prices across web and mobile catalogs.
Our mobile app photographs price tags right on the shop floor — uploading instantly or in a batch after the visit. We recognise the price, the promo and the barcode, and feed them into the same product graph.
Matching the same product across chains is the hardest problem in price monitoring — most vendors still do it manually, with teams of operators. Costless matches automatically: barcodes, GPC bricks, multilingual semantic vectors and a three-tier verification pass, at 99% accuracy. Your category manager opens one product and sees the truth from every source.
Pick the path that matches your role
Same dashboard, three different lenses. Each role gets the views, exports and alerts that matter for the decisions they own.
Know what your shoppers paid — at your stores and at the competition — without a mystery-shopping team. Live competitive grid, receipt-verified prices, and alerts the moment a competitor changes a price in your category.
See the retailer view →See your products on every shelf, in every receipt, in every catalog — at the barcode level. Cross-retailer promo timelines, distribution coverage and loyalty-discount realised prices.
Pull your brand barcodes →Plan next quarter pricing on data your reps cannot gather alone. Regional price spread, promo timelines with validity windows, and new-entrant visibility across every chain we cover.
Talk to a category specialist →Two purpose-built views. One export pipeline.
Both tools draw from the same receipt-and-flyer feed, so numbers in comparison match numbers in trends.
Your price, cost and margin side by side with competitor prices — regular and promo, with stock status, update date and deviation from the market minimum. Category, store and margin filters, summary KPIs, and XLSX/CSV/PDF export.
See plans & pricing →A price-movement chart for a single SKU over 30 days to 2 years: your price per store, competitor lines and promo windows. Spot promotions, margin shifts and stock-outs.
Available per productDownload CSVs or set alerts when a competitor undercuts you by a threshold you choose.
Three files — and the dashboard comes alive
No integrations, no implementation project: upload the data you already keep in Excel. The system suggests how your spreadsheet columns map to Costless fields — you only confirm.
Category tree
Upload your categories from xls/xlsx: id, name, parent category. The column mapping adapts to your file structure — including picking the right workbook sheet.
Product catalog
xlsx or csv: product name and category are required; SKU, brand, barcodes and pack size — when you have them. A preview shows the first rows and suggests the mapping.
Price files
Upload prices by SKU on your own schedule: retail, cost, promo price with validity dates, supplier and back-bonus — per store or chain-wide.
Automatic matching
Your products map themselves to Costless normalized products — via barcodes and names. From that moment the comparison dashboard shows your items next to competitors.
Subscribe as SaaS. No implementation project.
Price comparison and trends are available by subscription: pick a plan, pay by card, and the dashboard opens right after checkout. Cancel anytime.
- Up to 5 competitor stores monitored
- 3 categories
- Price history: 90 days
- Up to 500 SKUs
- Daily updates
- Up to 10 competitor stores monitored
- 20 categories
- Price history: 730 days
- Up to 5000 SKUs
- Real-time alerts
Every plan includes team access: invite colleagues to the account and manage their permissions by role. Plan limits apply to monitored competitor stores, categories, SKUs and price-history depth.
Prices in USD per month, VAT excluded.
Most tools see half the picture
Costless does not compete head-on with dynamic-repricing engines or field-execution apps — we feed them the data they are missing. Here is the structural difference between the four categories of tools you may already be evaluating.
| Capability | Costless | Online crawlers | Field-execution apps | Pricing engines |
|---|---|---|---|---|
| Online competitor prices | ✅ | ✅ | ❌ | 🟡 |
| Receipt-verified prices actually paid | ✅ | ❌ | ❌ | ❌ |
| Flyer / promo-window OCR | ✅ | ❌ | ❌ | ❌ |
| In-store price-tag collection (photo) | ✅ | ❌ | ✅ | ❌ |
| Barcode-level (EAN/UPC) graph | ✅ | 🟡 | ❌ | 🟡 |
| Public consumer surface (SEO/AEO) | ✅ | ❌ | ❌ | ❌ |
| FMCG / grocery specialisation | ✅ | 🟡 | 🟡 | 🟡 |
| MAP / RRP enforcement workflow | 🟡 | ✅ | ❌ | ❌ |
| Dynamic repricing engine | ❌ | ✅ | ❌ | ✅ |
Legend: ✅ native · 🟡 partial · ❌ not offered. Costless is designed to feed your pricing engine, not replace it — ask us about integration patterns.
From receipt to dashboard
A reproducible pipeline. Every number on the dashboard is traceable back to a receipt line, a catalog page, a parser run, or a price-tag photo.
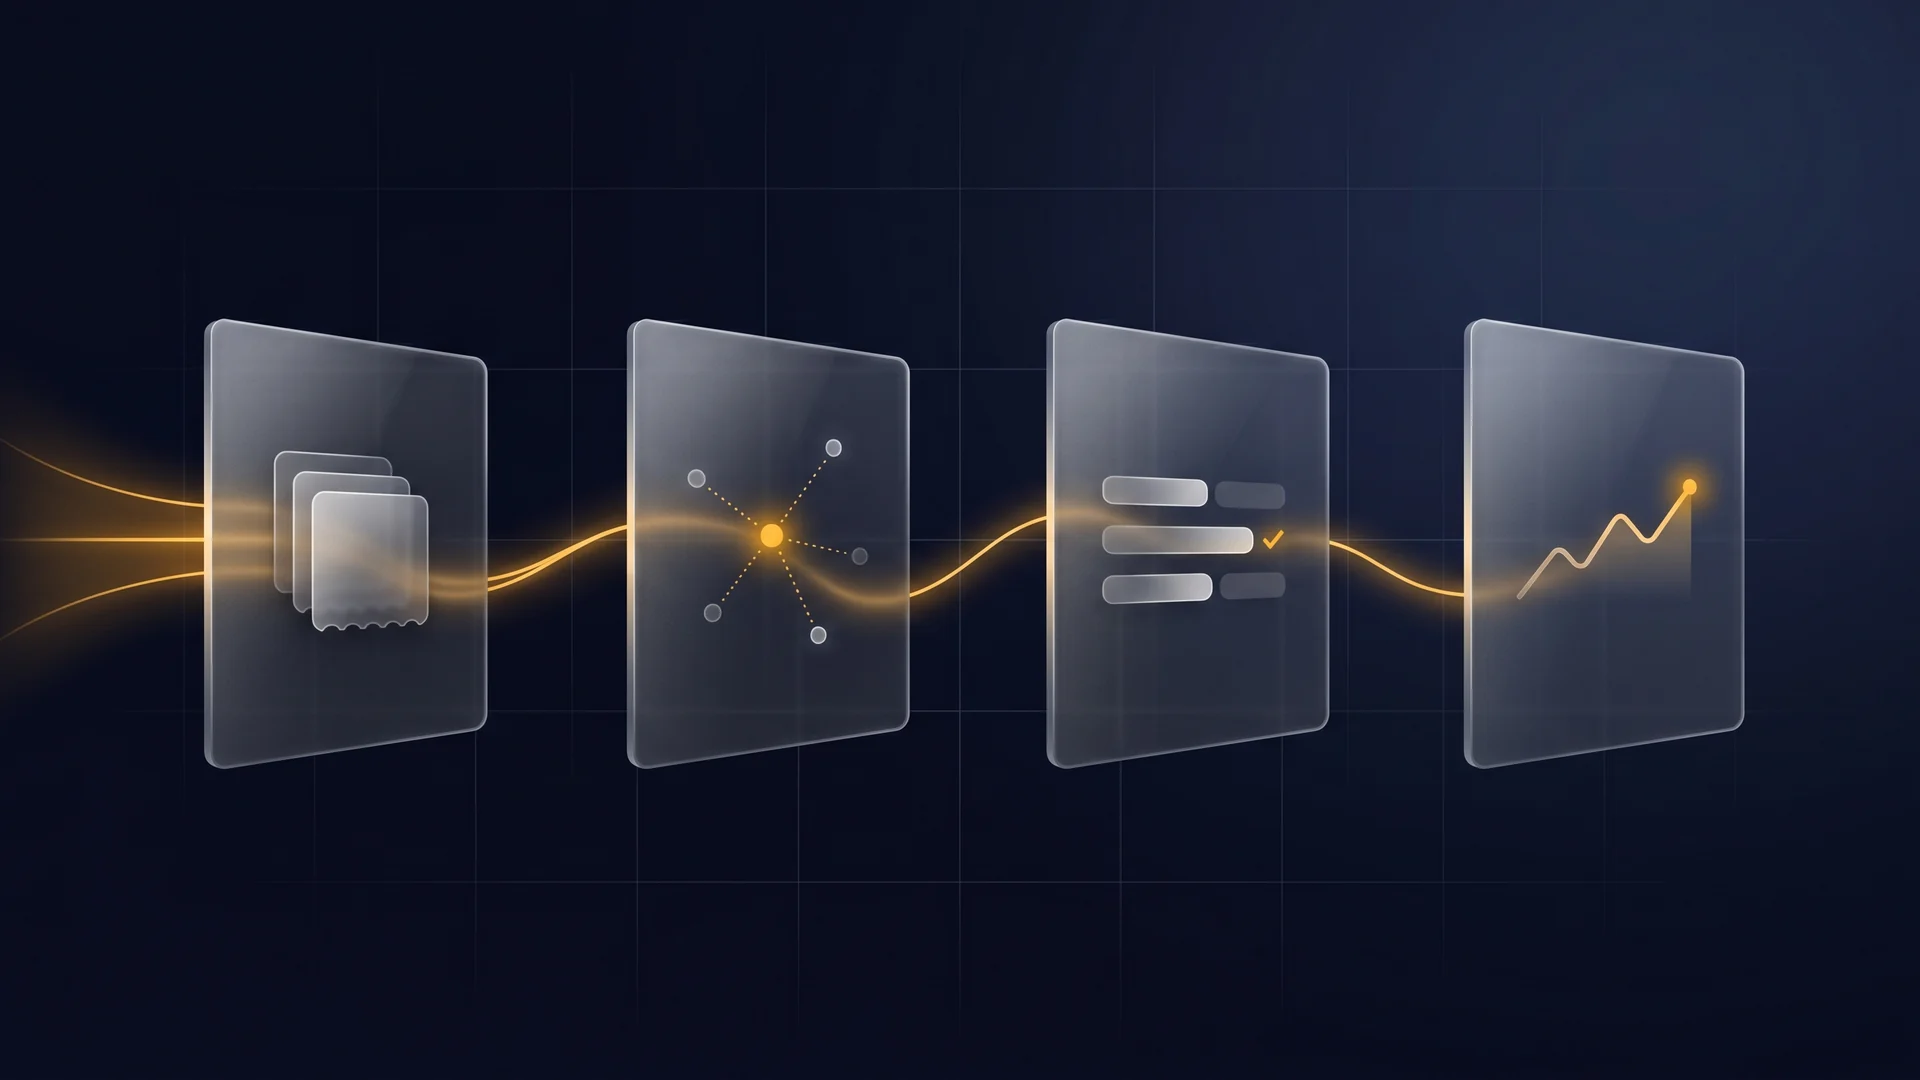
Collect
Shopper receipts, retailer catalogs, parser feeds and in-store price-tag photos stream into a single normalised product graph.
Match
Products are aligned across retailers using barcodes, GPC bricks and semantic vectors.
Compare
Your team gets a live dashboard: pick a product, pick retailers, pick a date range.
Deliver
Browser dashboard, CSV export, JSON/XML API, or scheduled email digest — whichever fits how your team already works.
Common questions about Costless Insights
What is Costless Insights?
Costless Insights is a price-intelligence platform for retailers, brands and distributors. It combines shopper receipts, retailer catalogs, direct site coverage and in-store price-tag photos into one barcode-level dashboard with live comparison, historical trends and CSV/API export. You can subscribe to it as SaaS.
How is Costless different from a price-scraping tool?
Crawlers only see the shelf tag a website displays. Costless adds what shoppers actually paid (240,000+ receipts processed) and what promo catalogs actually promised (weekly OCR), so loyalty discounts and basket promos that crawlers miss are visible.
Which countries and retailers are covered?
Live coverage spans 25+ countries with deepest density in Ukraine, Poland, the Baltics, the UK and Canada. Shopper receipts are digitised with OCR. New retailers are added every month.
What data export formats are supported?
Costless delivers data via browser dashboard, CSV download, JSON/XML API and scheduled email digest. The API supports per-barcode price history, retailer-by-retailer comparison, and flyer-promo metadata with validity windows.
How accurate is the product matching?
Costless reconciles signals at the EAN/UPC barcode level using GPC bricks (GS1 standard), multilingual semantic vectors and a three-tier verification pass. Match accuracy is 99% on packaged FMCG and 95%+ on private-label SKUs.
Can Costless feed our pricing engine or BI stack?
Yes. Costless is designed as a data source, not a replacement for dynamic-repricing engines or BI platforms. Ask for our integration patterns with Snowflake, BigQuery, common ERPs, and major repricing engines.
What do I need to get started?
Three files from Excel: a category tree (xls/xlsx), a product catalog (name and category required; SKU, brand and barcodes when available) and a price file. Column mapping is suggested automatically, products match themselves to Costless normalized products — and the comparison dashboard works the same day.
Ready to see your products?
Tell us which products or product lists you want to track and we will set up a demo dashboard with live data — typically within 48 hours. Or subscribe right away and open the dashboard today.